Code-based instrumentation
Introduction
This part of the exercise extends the zero-code instrumentation approach, by using instrumentation libraries and manual instrumentation in conjunction with the full automatic approach.
To differentiate from the upcoming manual instrumentation this step can be seen as a hybrid approach.
Learning Objectives
By the end of this chapter, you should be able to:
- Understand how to extend zero-code instrumentation with usage of libraries or mixing with manual instrumentation
- Apply this form of instrumentation to an existing Java and Python application
- Have an understanding of how much you need to interfere with source code in order to get a certain degree of information depth
Background
The long-term vision of OpenTelemetry is that third-party libraries or frameworks ship with native OpenTelemetry instrumentation, providing out-of-the-box observability. However, as of now, some projects do not yet have native support for the (partially still evolving) OpenTelemetry APIs. To bridge this gap, (temporary) solutions have been developed in the form of instrumentation libraries. The core idea is to increase the adoption of OpenTelemetry without placing the entire burden on the back of the library maintainers. An instrumentation library is a standalone (separately installed) library, whose sole purpose is to inject OpenTelemetry API calls into another popular library or framework which currently lacks native integration. There is no unified way to achieve this, because it highly depends on the mechanisms of provided by the programming language and the library. Examples range from wrapping interfaces, monkey-patching code, registering callback on library-specific hooks to translating existing telemetry into OpenTelemetry. The OpenTelemetry has a registry which can be used to find instrumentation libraries. A brief look into the libraries reveals that there are already a lot of libraries for many frameworks and programming languages. But many of these libraries are not stable yet and are in an alpha or beta state. To find a library that fits your software stack, just visit the registry and search for the framework or programming language that you are using.
While instrumentation libraries offer a valuable solution for enhancing observability in third-party libraries or frameworks that lack native OpenTelemetry support, they also present certain challenges. These include the necessity to manage additional dependencies, which adds complexity to the codebase and requires careful consideration of maintenance overhead. Additionally, as instrumentation libraries are still relatively new compared to native integrations, they may face limitations such as less community support, fewer resources, and a higher risk of encountering issues due to their nascent nature.
How to perform the exercise
- This exercise is based on the following repository repository
- All exercises are in the subdirectory
exercises. There is also an environment variable$EXERCISESpointing to this directory. All directories given are relative to this one. - Initial directory:
automatic-instrumentation/initial - Solution directory:
automatic-instrumentation/solution - Java source code:
automatic-instrumentation/initial/todobackend-springboot - Python source code:
automatic-instrumentation/initial/todoui-flask
Exercise - Java instrumentation annotations
The previous exercise using Java zero-code instrumentation can illustrate the need for additional libraries.
Using OpenTelemetry’s Java agent - as we did - covered a generic set of set of instrumentation libraries and we did not have to worry about selecting any of them individually.
This makes it very helpful to get started with as no modification or rebuild of the application is necessary.
Sometimes however we want to observe aspects of our application that don’t naturally align with these standard instrumentation points. Developers often encapsulate related logic in dedicated functions to improve code maintainability and organization. The OpenTelemetry agent may lack awareness of these custom functions. It has no way of knowing whether they are important and what telemetry data to capture from them.
To apply a more granular configuration to the already existing agent you can use the opentelemetry-instrumentation-annotations library.
If the Java part of the application is still running from this exercise, stop it using Ctrl+C in the corresponding terminal window.
This library needs to be added to the application source code. To be precise to the build dependencies of the application in the first place. As the sample application uses Maven as build tool, we need to locate the pom.xmlin the root folder of the application.
Change to the directory within to exercises/automatic-instrumentation/initial/todobackend-springboot path, if you are in the project root directory it is:
cd $EXERCISES
cd automatic-instrumentation/initial/todobackend-springboot
Once you open it up in the editor it, you will see there is a section containing dependencies. If you prefer you can do this via command-line, but we recommend to use the editor within VS Code.
Locate the dependencies section within the pom.xml file:
<dependencies>
...
</dependencies>
Add the following dependency to it and make sure to align/indent with the already existing ones. (the order of dependencies in the file does not matter)
		<dependency>
			<groupId>io.opentelemetry.instrumentation</groupId>
			<artifactId>opentelemetry-instrumentation-annotations</artifactId>
			<version>2.8.0</version>
		</dependency>
and save the file.
Now re-run the build command
mvn clean packageThis change will not have any effect yet on how the application will be monitored, but it will allow us to apply more granular configuration.
Let’s repeat some steps from the zero-code exercise. In case the docker container is still running, let it run. Otherise start using the command:
docker run -d --name jaeger \
  -e COLLECTOR_OTLP_ENABLED=true \
  -p 16686:16686 \
  -p 14268:14268 \
  -p 4317:4317 \
  -p 4318:4318 \
  jaegertracing/all-in-one
Download the agent jar file, if it is not there yet.
wget https://github.com/open-telemetry/opentelemetry-java-instrumentation/releases/download/v2.8.0/opentelemetry-javaagent.jarAnd make sure the environment variables are set appropriately:
export OTEL_TRACES_EXPORTER=otlp
export OTEL_METRICS_EXPORTER=none
export OTEL_LOGS_EXPORTER=none
Now run the newly build jar including the agent:
java -javaagent:./opentelemetry-javaagent.jar -jar target/todobackend-0.0.1-SNAPSHOT.jarLet this process run in it’s terminal window and switch to a new one. Within that new window execute:
curl -X POST localhost:8080/todos/NEWOpen the Jaeger Web UI and search for the last trace we just generated. It will look like this:
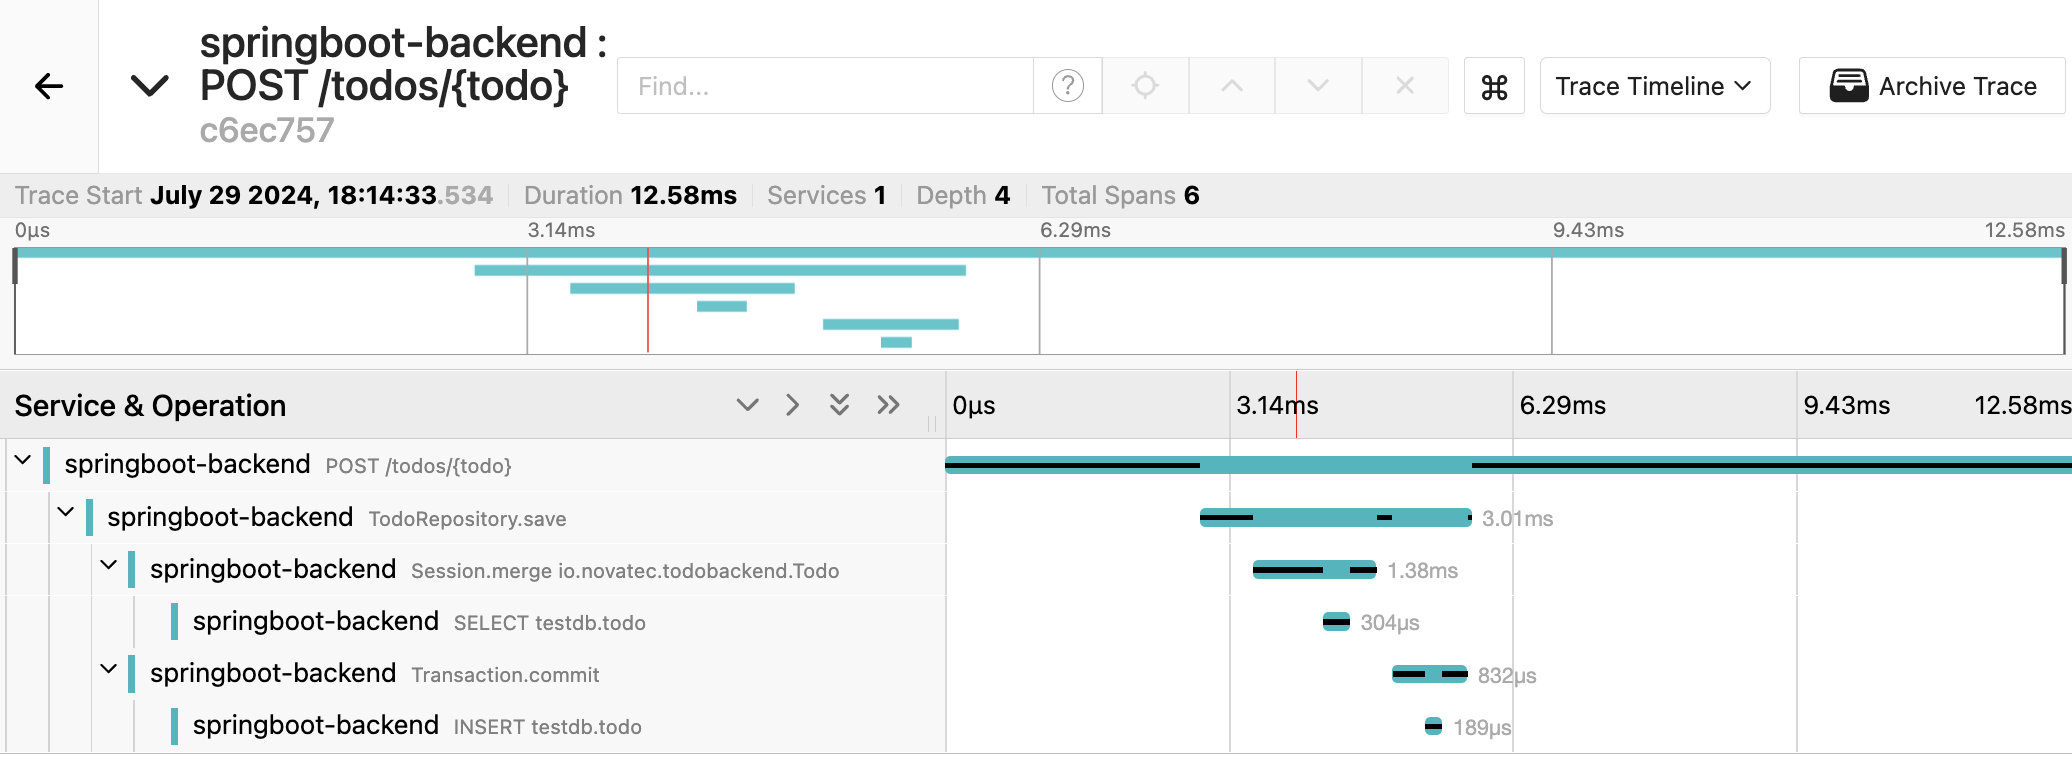
Jaeger trace - Auto instrumentation
Now open the Java source file under todobackend-springboot/src/main/java/io/novatec/todobackend/TodobackendApplication.java directly here in the editor.
You will see the two following methods:
	@PostMapping("/todos/{todo}")
	String addTodo(@PathVariable String todo){

		this.someInternalMethod(todo);
		//todoRepository.save(new Todo(todo));
		logger.info("POST /todos/ "+todo.toString());

		return todo;

	}

	String someInternalMethod(String todo){

		todoRepository.save(new Todo(todo));
    ...
		return todo;

	}
The addTodo method is the entry point when the REST call arrives at the application. We can see that in the Jaeger trace. This is visible in the entry span called POST/todos/{todo}:
Jaeger trace - Auto instrumentation
With the invocation of todoRepository.save(new Todo(todo)); the new item will be persisted in the database.
This is also visible in the Jaeger trace.
What we cannot see however is the method in between someInternalMethod. This one is invoked by addTodo and invokes todoRepository.save but it is not being displayed in the trace.
In order to change this we need to add an annotation to this method in the code.
Within the source code of the Java class TodobackendApplication.java add the following import statements to the top.
import io.opentelemetry.instrumentation.annotations.SpanAttribute;
import io.opentelemetry.instrumentation.annotations.WithSpan;
This enables functionality in the code that we provided through adding the new maven dependency.
As a next step we need to annotate the method. Locate the someInternalMethod and place the @WithSpan annotation just above as shown in the following code snippet.
	@WithSpan
	String someInternalMethod(String todo){
The file will be automatically saved by VSCode.
Select the terminal window where the Java process runs and press Ctrl+C. However do not stop the Jaeger docker container, we still need it.
(This should put you back into the todobackend-springboot directory, where the pom.xml file is located. If not change the directory as before.)
Rebuild the Java application with the new code.
mvn clean packageRun the newly build jar file:
java -javaagent:./opentelemetry-javaagent.jar -jar target/todobackend-0.0.1-SNAPSHOT.jarAfter it has come up, switch to another terminal window and generate some more load as you did before:
curl -X POST localhost:8080/todos/TEST
curl localhost:8080/todos/
curl -X DELETE localhost:8080/todos/TEST
Access the Jaeger UI again and find the latest traces.
Observe the POST call once more.
You will now see that between the entry span POST/todos/{todo} and the third span todoRepository.save there is one called todoRepository.someInternalMethod. This is due to the annotation we did.
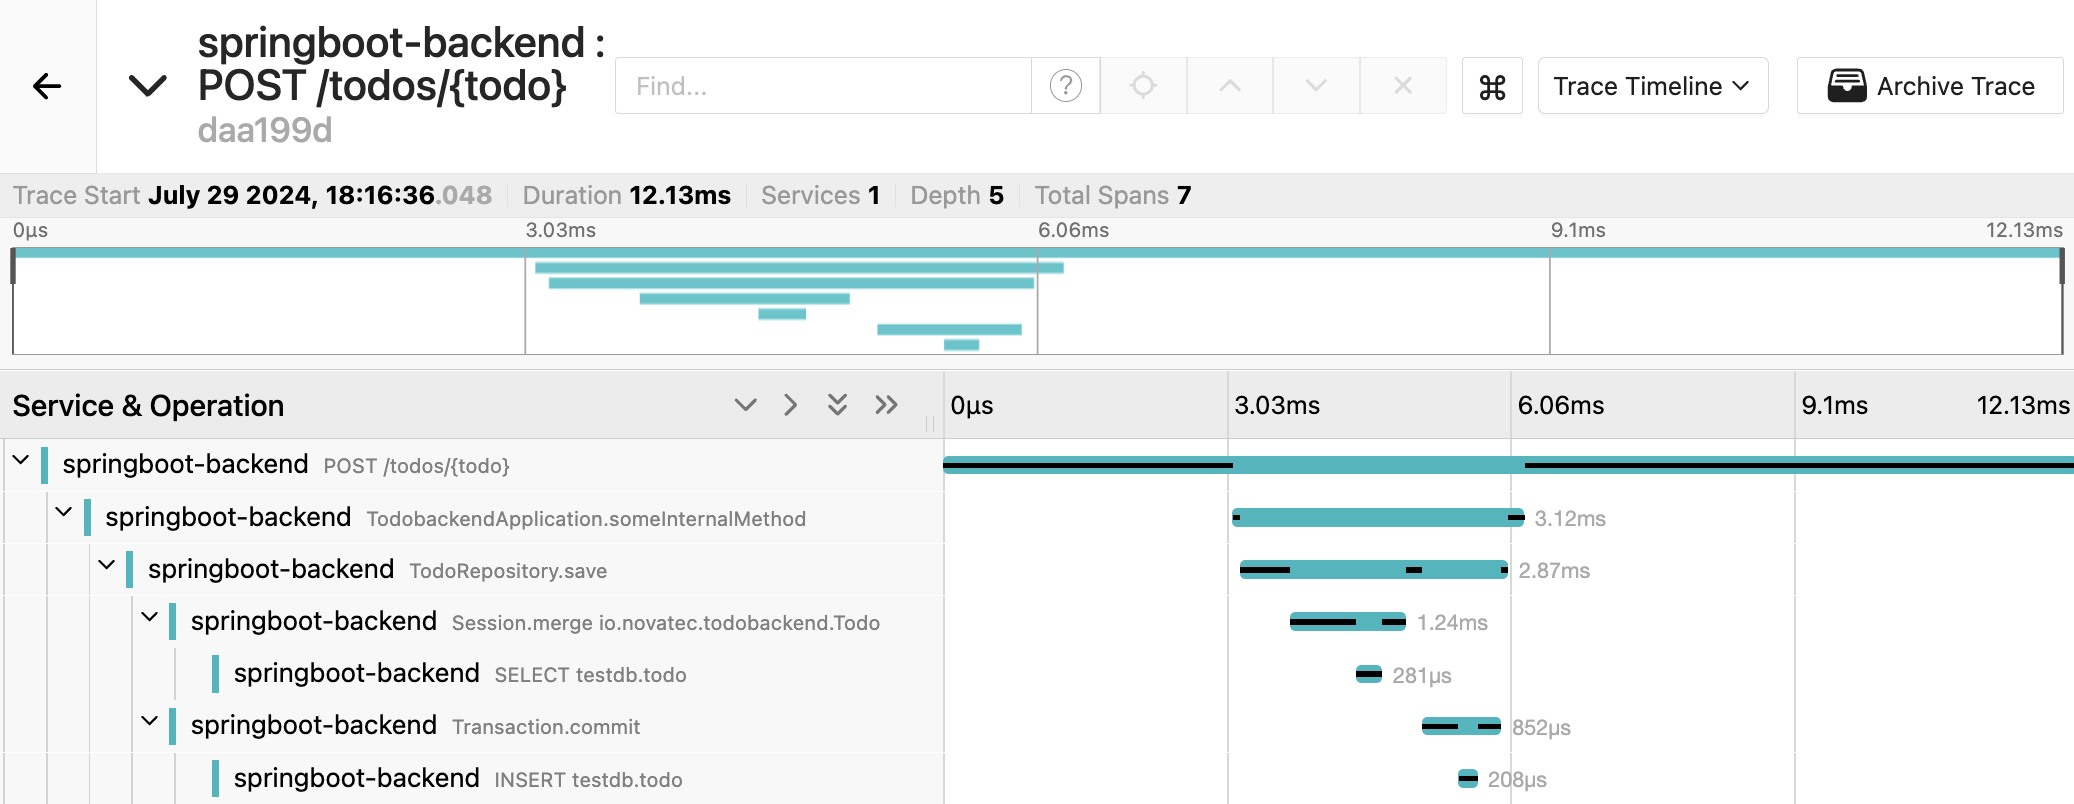
Jaeger trace - Auto instrumentation with annotations
If you expand the line of trace in the Jaeger UI you will get Tags and Process details. Expand all of it.
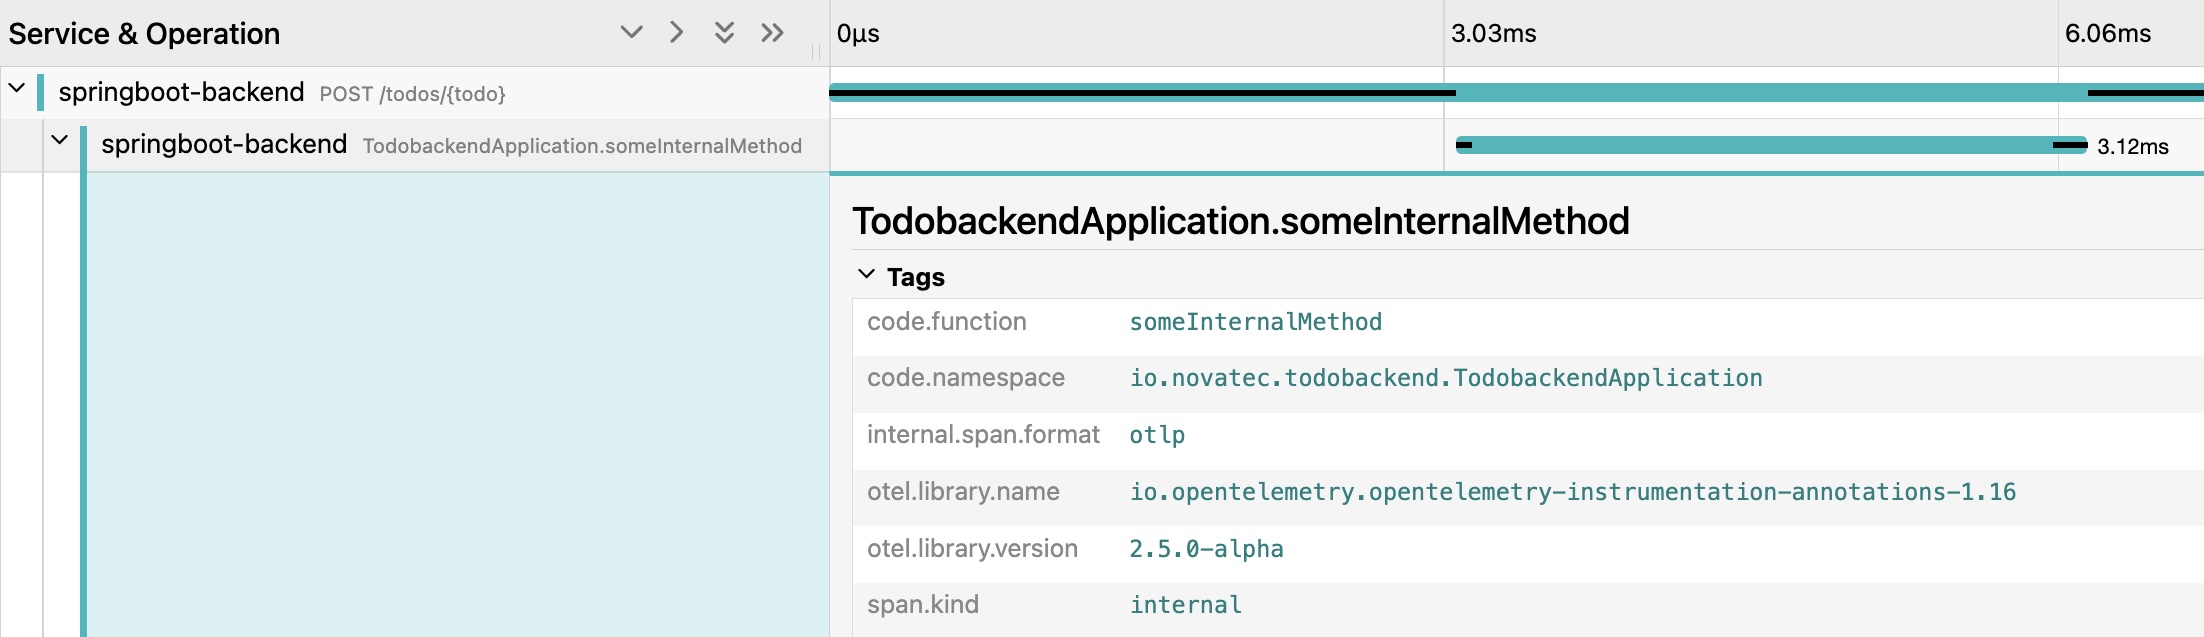
Jaeger trace - Span Detail
Among other details you will be able to see the details of the method and name of the used library.
code.function - someInternalMethod
code.namespace - io.novatec.todobackend.TodobackendApplication

otel.library.name - io.opentelemetry.opentelemetry-instrumentation-annotations-1.16
otel.library.version - 2.5.0-alpha
Let’s take this one step further. The library does not only allow to annotate methods and hence observe their specific span details, it also let’s you observe the contents of variable parameters.
In order to achieve this it is required to modify the TodobackendApplication.java again. So stop the Java process again with Ctrl+C and open the source code file in the editor.
Navigate to the method signature of the someInternalMethod method. This time you need to add the @SpanAttribute annotation right in front of the String todo parameter like shown here:
	@WithSpan
	String someInternalMethod(@SpanAttribute String todo){
That’s it. Now save, build and run it again.
mvn clean packagejava -javaagent:./opentelemetry-javaagent.jar -jar target/todobackend-0.0.1-SNAPSHOT.jarAfter it has come up, generate some more load:
curl -X POST localhost:8080/todos/SMILEAccess the Jaeger UI again and find the latest traces. Expand it like you did before and focus on the Tags part in the trace.
As the latest entry you should now see
todo - SMILE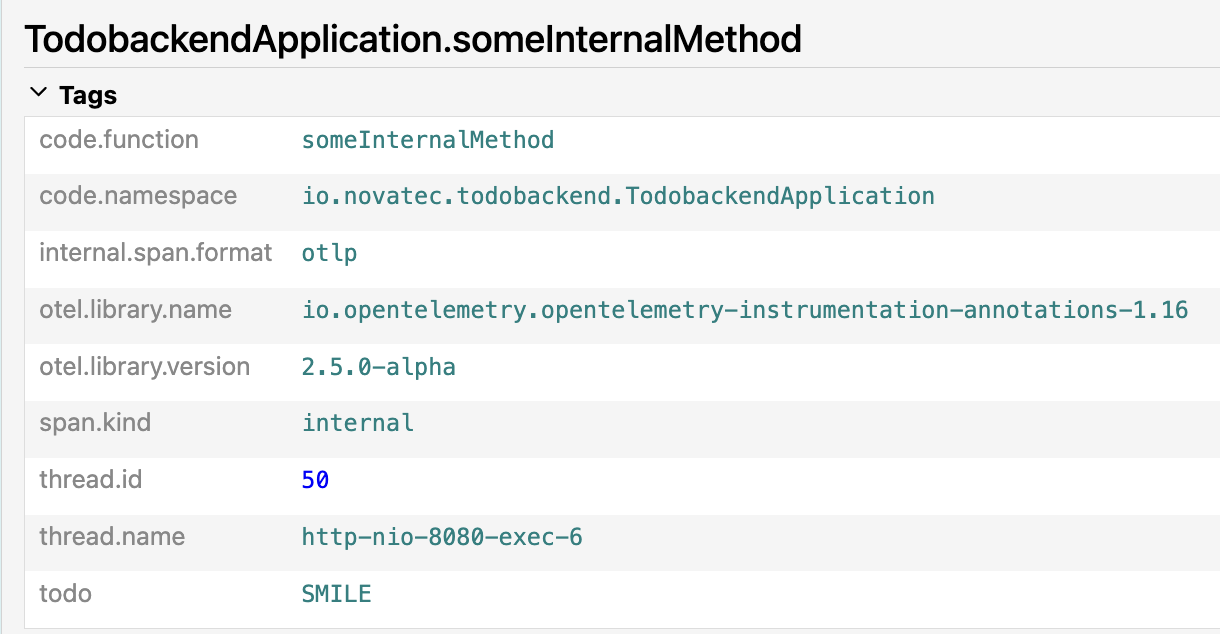
Jaeger trace - Span Detail with value
This means you can now also see the specific parameter which has been passed and relate it to a slow performing call in case it happens.
Leave the Java application running, you will need it for the Python part as well.
Alternative approach
These are no exercise steps, this is just supporting information.
An alternative approach to use the annotations library is by configuring it through environment variables. There are two environment variables you can use to configure the annotations library.
OTEL_INSTRUMENTATION_METHODS_INCLUDE and OTEL_INSTRUMENTATION_OPENTELEMETRY_INSTRUMENTATION_ANNOTATIONS_EXCLUDE_METHODS
As the name already implies they configure methods to be included as spans or excluded from instrumentation (e.g. if you want to suppress an existing @WithSpan implementation after code is already compiled)
In our example the corresponding environment setting to include the someInternalMethod to the spans without using the @WithSpan annotation in code would be:
export OTEL_INSTRUMENTATION_METHODS_INCLUDE=io.novatec.todobackend.TodobackendApplication[someInternalMethod]In case the @WithSpan annotation was already present in the compiled jar and you want to exclude it without rebuild you have to set:
export OTEL_INSTRUMENTATION_OPENTELEMETRY_INSTRUMENTATION_ANNOTATIONS_EXCLUDE_METHODS=io.novatec.todobackend.TodobackendApplication[someInternalMethod]Both environment variables only correspond with the @WithSpan annotation. There is no possibility (yet) to configure span attributes through environment setting. This only works on code level.
The part of the Java library exercise completes with this step.
exercise - Python mixed automatic and manual instrumentation
Change to the directory within to exercises/automatic-instrumentation/initial/todoui-flask path, if you are in the project root directory it is:
cd $EXERCISES
cd automatic-instrumentation/initial/todoui-flask
Similar to the exercise case in the Java example before, also in a Python there can be the requirement to get more observability information than the plain automatic instrumentation might reveal.
This example will show a mixed mode of automatic and manual instrumentation to achieve this behaviour and will already give a lookout to what will be covered in the dedicated manual instrumentation chapter.
In this case we will custom instrument the already existing auto instrumentation and add a way to access the processed todo item on the frontend side of the application.
Open the app.py Python source code in your editor.
Locate the 2 import statements on top:
import logging
import requests
import os
Add the following statement right underneath to import the trace API from OpenTelemetry:
# Import the trace API
from opentelemetry import trace
Directly after that add a statement to acquire a tracer
# Acquire a tracer
tracer = trace.get_tracer("todo.tracer")
The way we call it here does not matter. The name todo.tracer will later appear as such in the trace metadata.
So the resulting code after the edit should look like:
import logging
import requests
import os

# Import the trace API
from opentelemetry import trace

# Acquire a tracer
tracer = trace.get_tracer("todo.tracer")

app = Flask(__name__)
logging.getLogger(__name__)
logging.basicConfig(format='%(levelname)s:%(name)s:%(module)s:%(message)s', level=logging.INFO)
As a next step we will add a custom span to the trace which contains the information we want to have.
Locate the add function in the code, which starts like this:
@app.route('/add', methods=['POST'])
def add():
The central code block of this function receives the todo from the web UI and sends it to the backend. The code is supposed to look like this:
    if request.method == 'POST':
        new_todo = request.form['todo']
        logging.info("POST  %s/todos/%s",app.config['BACKEND_URL'],new_todo)
        response = requests.post(app.config['BACKEND_URL']+new_todo)
    return redirect(url_for('index'))
Replace it entirely with the following code block. (You can also edit manually, but replacing will avoid typos.)
    if request.method == 'POST':
        with tracer.start_as_current_span("add") as span:
            new_todo = request.form['todo']
            span.set_attribute("todo.value",new_todo)
            logging.info("POST  %s/todos/%s",app.config['BACKEND_URL'],new_todo)
            response = requests.post(app.config['BACKEND_URL']+new_todo)
    return redirect(url_for('index'))
As you can observe 2 lines of code have been added.
The following line
with tracer.start_as_current_span("add") as span:will create a new span and the line
span.set_attribute("todo.value",new_todo)will add the currently processed todo item as attribute to it.
This is all we need to do for now. Before you run it make sure all the environment variables are still set. If you have switched the terminal session they might now be active any more.
Execute:
export OTEL_LOGS_EXPORTER="none"
export OTEL_METRICS_EXPORTER="none"
export OTEL_TRACES_EXPORTER="otlp"
export OTEL_EXPORTER_OTLP_ENDPOINT="localhost:4317"
export OTEL_SERVICE_NAME=todoui-flask
export OTEL_EXPORTER_OTLP_INSECURE=true
After that you are good to go and run the autoinstrumented app again:
opentelemetry-instrument python app.pyNow access the both Web UIs again - the Python frontend and Jaeger. Add and remove some todos and observe the behaviour in Jaeger.
If you analyse an individual trace of todoui-flask with a POST operation, you will see an additional span in the trace.
This part will show up as 2nd in the list an is called todoui-flask add.
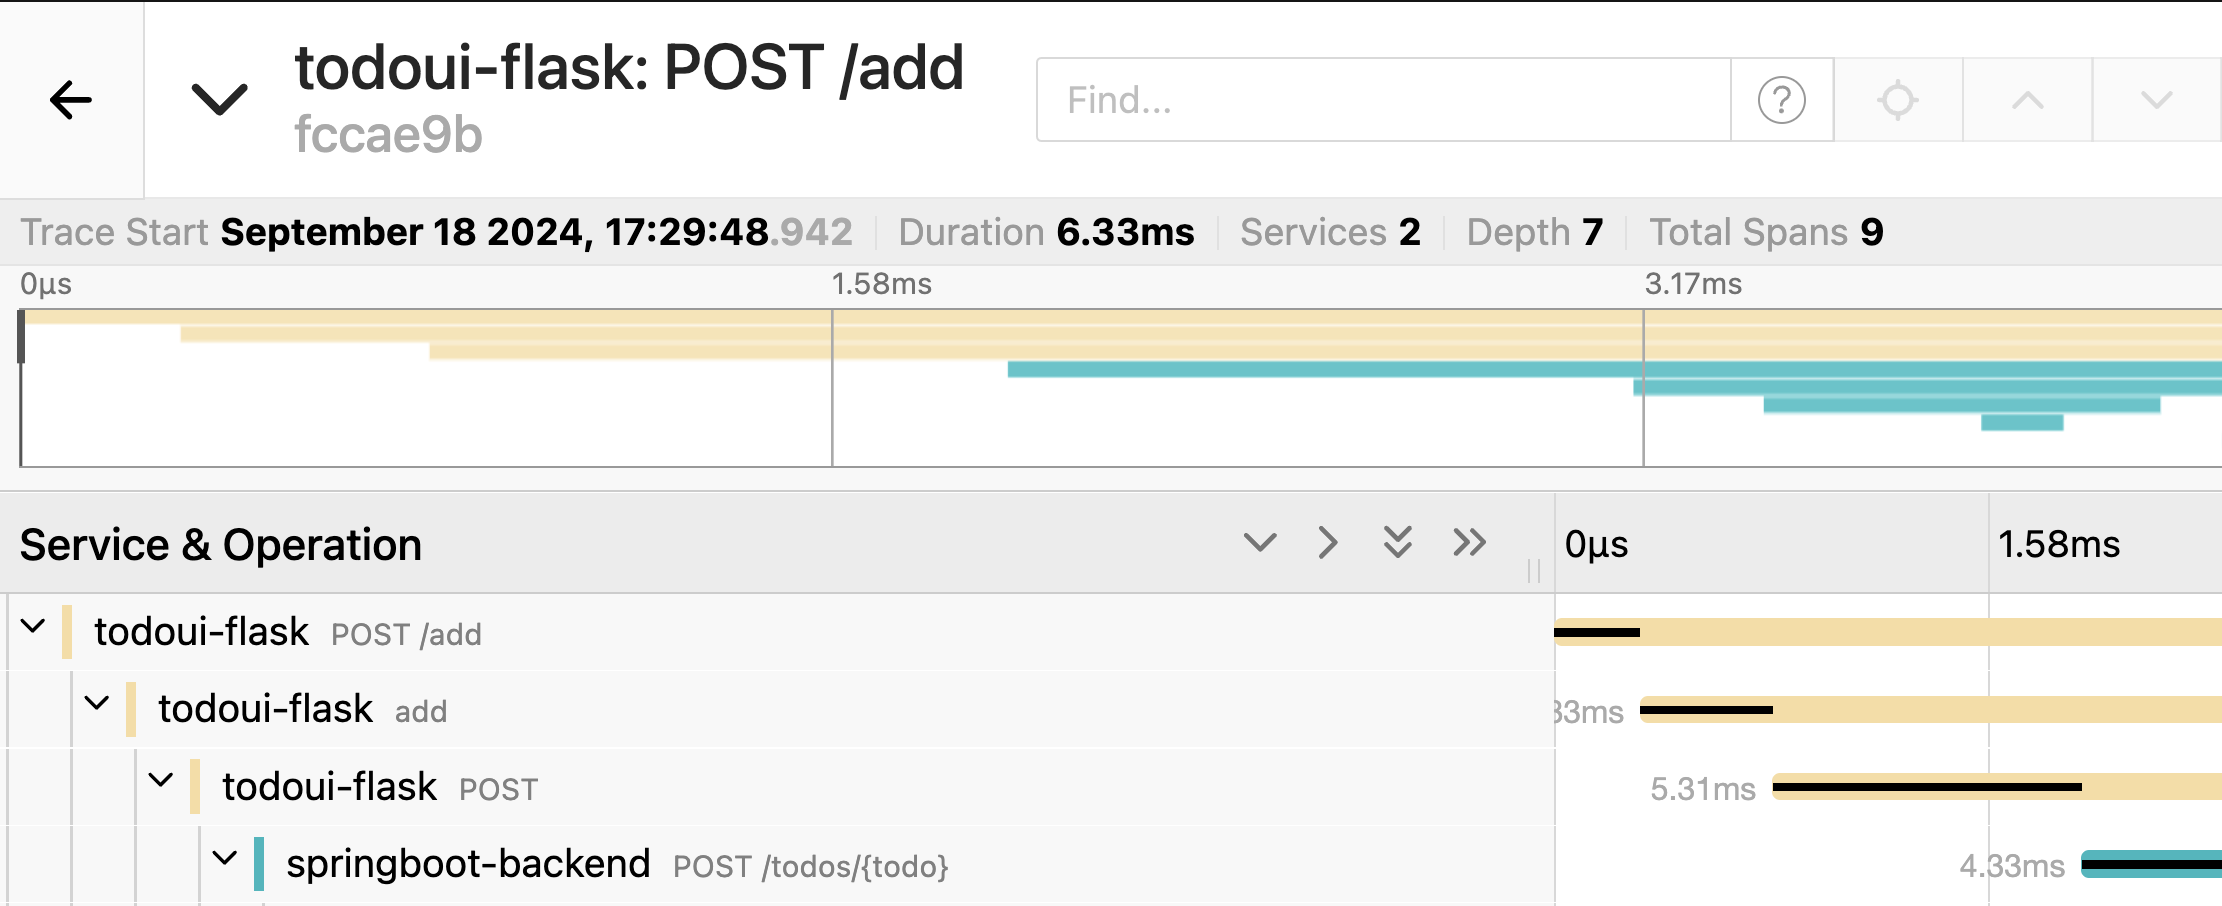
Jaeger trace - Custom span
Once you expand the details of this trace you will also see the value of the passed variable. Under the section of tags you see the todo.value.
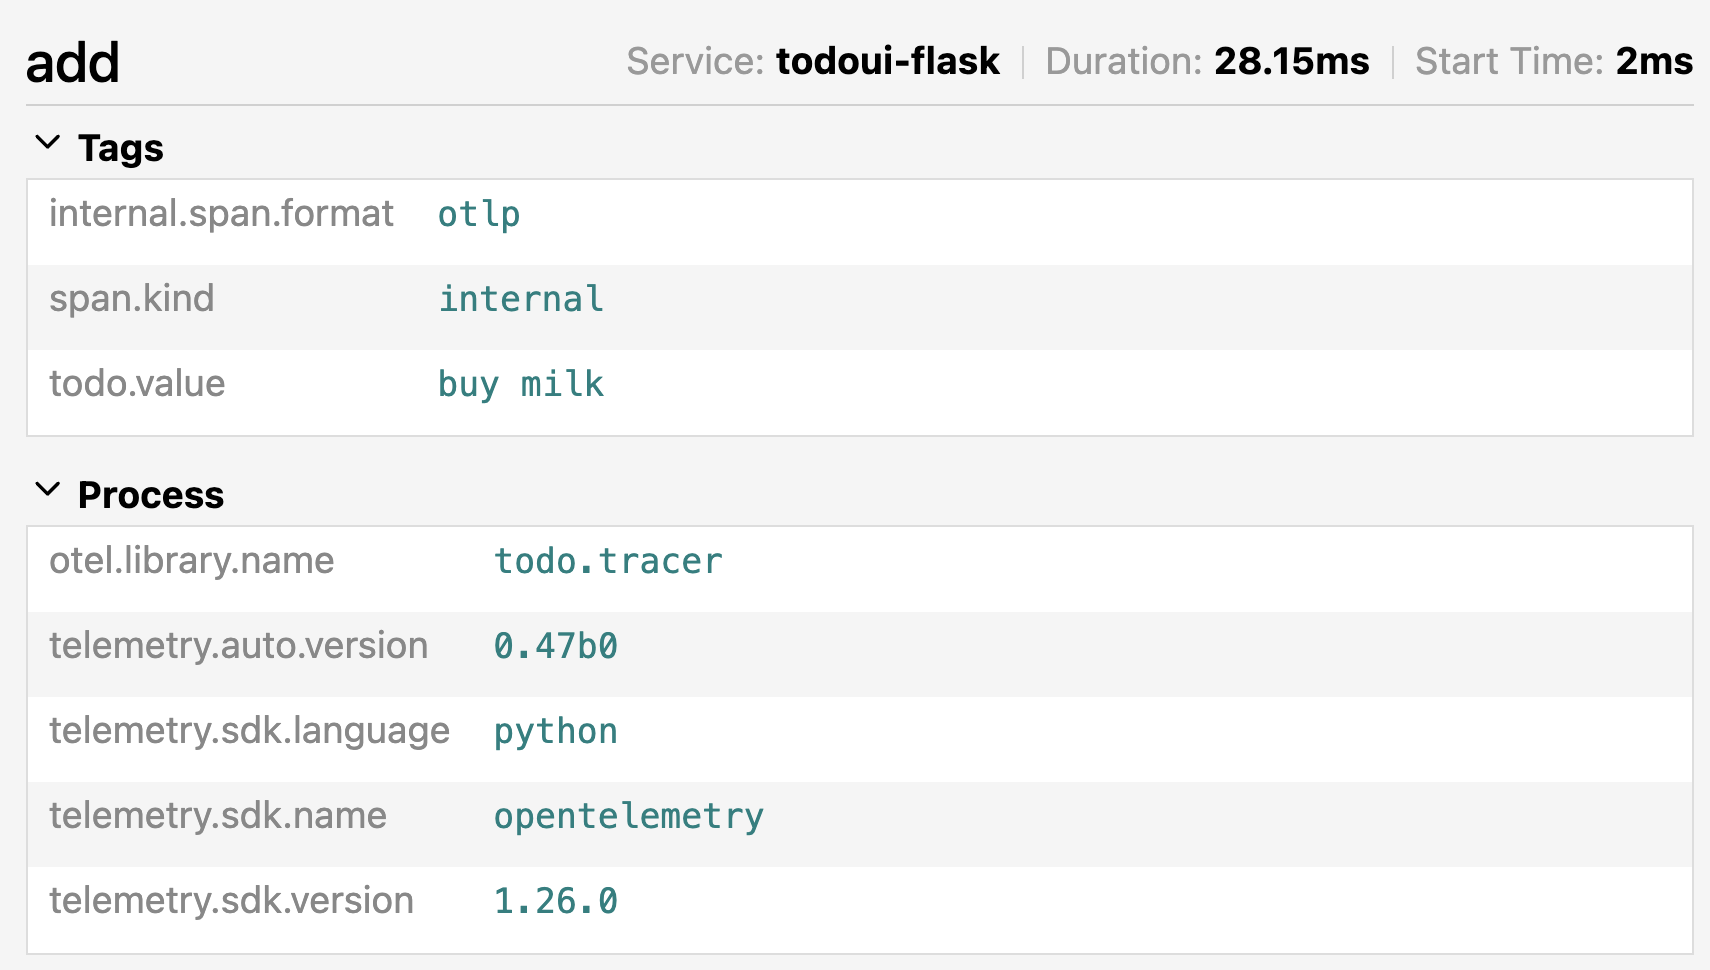
Jaeger trace - Custom span
Summary - What you have learned.
The first part of instrumenation of polyglot applications completes with this step.
You have seen and applied zero-code, automatic instrumentation for both Java and Python application components. The advantage here is obvious - there is no need to understand and modify source code. The limitation is also obvious - you are limited to what the default configuration will set. It is not possible to instrument custom methods or functions and trace internal variables.
To overcome these limitations you have seen two different approaches. Adding custom libraries to the source code and implementing annotations in the code or using a mixed mode of automatic and manual instrumentation.
It becomes clear that the more granular details you want to get out of your application the more you have to put instrumentation code into it.
The following chapter manual instrumentation will do this in full depth.
Please stop all Java, Python and docker processes.