Zero-code instrumentation
Introduction
Instrumentation libraries simplify the experience of adopting OpenTelemetry by injecting instrumentation into popular third-party libraries and frameworks. This is especially useful in situations where we don’t want to write manual instrumentation, but no native instrumentation is available. Since instrumentation libraries are developed and maintained by members of the OpenTelemetry community, we
- don’t have to wait for native instrumentation
- don’t put burden on the back of the library or framework maintainer
A common way to take advantage of instrumentation libraries is in combination with OpenTelemetry’s automatic instrumentation or also often referred to as ‘zero-code’ instrumentation.
In contrast to the API and SDK, auto-instrumentation allows us to dynamically inject observability into the application without having to make changes to the source code.
Generally speaking, auto-instrumentation is implemented by some kind of agent or runner. In this lab, we’ll use both a Java and Python application to understand how this is being done.
Learning Objectives
By the end of this chapter, you should be able to:
- Understand the concept of automatic or zero-code instrumentation
- Apply this form of instrumentation to an existing Java and Python application
- Use appropriate environment variables to configure the behaviour without touching the source code
- Have an understanding of both simplicity, but also limitations of this instrumentation type
Background information - byte code manipulation via Java agent
Before going into the steps to apply the zero-code version of the OpenTelemetry Java agent to our sample application, we have a short look on how this concept works under the hood in general.
The following snippet of Java code shows how an instrumentation can be passed to a given Java application.
public class MyAgent {
    public static void premain(String agentArgs, Instrumentation inst) {
        inst.addTransformer(new MyTransformer());
    }
}

public class MyTransformer implements ClassFileTransformer {
    @Override
    public byte[] transform(
            ClassLoader loader,
            String className,
            Class<?> classBeingRedefined,
            ProtectionDomain protectionDomain,
            byte[] classfileBuffer
    ) {
        // Perform bytecode transformation
        // ...

        // Return the modified bytecode
        return modifiedBytecode;
Most developers that have basic knowledge of Java will know that the main() method is the entry point of a Java program.
In addition to that, the Java Virtual Machine (JVM) also supports two other types of entry points: premain and agentmain.
Both premain and agentmain have an optional parameter to pass an Instrumentation instance as an argument to the method.
Java’s built-in Instrumentation interface provides access to low-level functionality of the JVM.
It operates on a byte code level and provides mechanisms to modify and inspect the behavior of Java applications at runtime.
Most notables, the ClassFileTransformer API allows you to take a class file (basically a compilation unit of a .java file) and manipulates the byte array before it is loaded.
Instead of trying to identify classes and methods and edit the byte code directly, we typically use libraries such as Byte Buddy that make these byte code transformations more convenient.
With the help of these tools, we are able to develop static and dynamic Java agents.
On a high level, auto-instrumentation agents of different APM vendors (e.g. Instana, …) work similarly.
On startup, the agent discover what clients (e.g. JDBC driver, HTTP Client) are used by the application and decides whether to instrument them.
After identifying the methods of interest (e.g. that do the HTTP calls), a transformer rewrites the byte array to inject the custom instrumentation logic that captures telemetry.
The transformer returns the modified byte code.
To attach the agent to the target application, its program is packaged as a separate .jar file and passed to the Java runtime via the -javaagent argument.
This allows the agent to modify the byte code of classes as they are loaded into the Java Virtual Machine (JVM).
Fortunately, OpenTelemetry simplifies this process by providing an opentelemetry-javaagent.jar.
This jar includes instrumentation libraries for various frameworks and third-party libraries. It also contains components like OpenTelemetryAgent and AgentInstaller, which initiate the process, analyze the application, detect, and load available third-party instrumentation libraries.
These components leverage the mentioned mechanisms to adapt the byte code of Java classes at runtime.
Additionally, the OpenTelemetryInstaller configures emitters based on configuration options provided at invocation time (e.g., via the -D flag or Java properties file) to produce and deliver telemetry without any additional work on part of the user.
This section should highlight that auto-instrumentation is built on mechanisms specific to the given programming language. Other languages may lack similar native capabilities. Therefore, not all languages come with support for auto-instrumentation.
Exercise
How to perform the exercise
- This exercise is based on the following repository repository
- All exercises are in the subdirectory
exercises. There is also an environment variable$EXERCISESpointing to this directory. All directories given are relative to this one. - Initial directory:
automatic-instrumentation/initial - Solution directory:
automatic-instrumentation/solution - Java source code:
automatic-instrumentation/initial/todobackend-springboot - Python source code:
automatic-instrumentation/initial/todoui-flask
Make sure the docker compose environment from Otel in Action chapter is stopped.
Otherwise you will run into port conflicts.
You can run docker compose ls to verify. If it shows a process running in the otel-in-action directory,
please switch to this directory and call docker compose down to stop it.
Instrumentation of the Java (Spring Boot) component
Change to the directory automatic-instrumentation/initial/todobackend-springboot path. If you are in the project root directory it is:
cd $EXERCISES
cd automatic-instrumentation/initial/todobackend-springboot
This is the same Java application as used for the backend component in the OpenTelemetry in Action chapter.
Build the Java project using maven:
mvn clean packageThis will take a few seconds to complete. It will create an executable jar file in the target subdirectoy which you can run.
Run it with the following command:
java -jar target/todobackend-0.0.1-SNAPSHOT.jarThis will take the control over your terminal. The output should look like:
  .   ____          _            __ _ _
 /\\ / ___'_ __ _ _(_)_ __  __ _ \ \ \ \
( ( )\___ | '_ | '_| | '_ \/ _` | \ \ \ \
 \\/  ___)| |_)| | | | | || (_| |  ) ) ) )
  '  |____| .__|_| |_|_| |_\__, | / / / /
 =========|_|==============|___/=/_/_/_/
 :: Spring Boot ::                (v3.2.2)

2024-04-17T06:43:10.236+02:00  INFO 73702 --- [springboot-backend ] [           main] i.n.todobackend.TodobackendApplication   : Starting TodobackendApplication v0.0.1-SNAPSHOT using Java 21.0.1 with PID
Stop it again using Ctrl+C
At this point there is no OpenTelemetry instrumentation present. It’s just a stand-alone Spring Boot application.
To add this download the OpenTelemetry agent from GitHub with the following command. Make sure you are still in the same directory where you successfully executed the maven command.
wget https://github.com/open-telemetry/opentelemetry-java-instrumentation/releases/download/v2.8.0/opentelemetry-javaagent.jarThis will download a jar file, which you need to attach to the Java process. You don’t need to modify any code or dependency in your project, you can simply add it as javaagent parameter like this:
java -javaagent:./opentelemetry-javaagent.jar -jar target/todobackend-0.0.1-SNAPSHOT.jarRight at the start of the app you should see the following output:
[otel.javaagent 2024-04-17 06:56:37:329 +0200] [main] INFO io.opentelemetry.javaagent.tooling.VersionLogger - opentelemetry-javaagent - version: 2.3.0This means that the agent as successfully been picked up. It will run the application as before, but in the output you will see a lot of errors, e.g.
[otel.javaagent 2024-04-16 22:55:15:812 +0200] [OkHttp http://localhost:4318/...] ERROR io.opentelemetry.exporter.internal.http.HttpExporter - Failed to export spans. The request could not be executed. Full error message: Failed to connect to localhost/[0:0:0:0:0:0:0:1]:4318
java.net.ConnectException: Failed to connect to localhost/[0:0:0:0:0:0:0:1]:4318
        at okhttp3.internal.connection.RealConnection.connectSocket(RealConnection.kt:297)
        at okhttp3.internal.connection.RealConnection.connect(RealConnection.kt:207)
        at okhttp3.internal.connection.ExchangeFinder.findConnection(ExchangeFinder.kt:226)
        at okhttp3.internal.connection.ExchangeFinder.findHealthyConnection(ExchangeFinder.kt:106)
        at okhttp3.internal.connection.ExchangeFinder.find(ExchangeFinder.kt:74)
        at okhttp3.internal.connection.RealCall.initExchange$okhttp(RealCall.kt:255)
Stop the application again using Ctrl+C
The reason for this behaviour is that the agent is not configured and hence falling back to defaults.
The default configuration will make the agent look for a collector, which is currently not present in our environment.
So we need to overwrite the default settings. The most important one is to tell the agent to not look for a collector, but export all the collected information to the console.
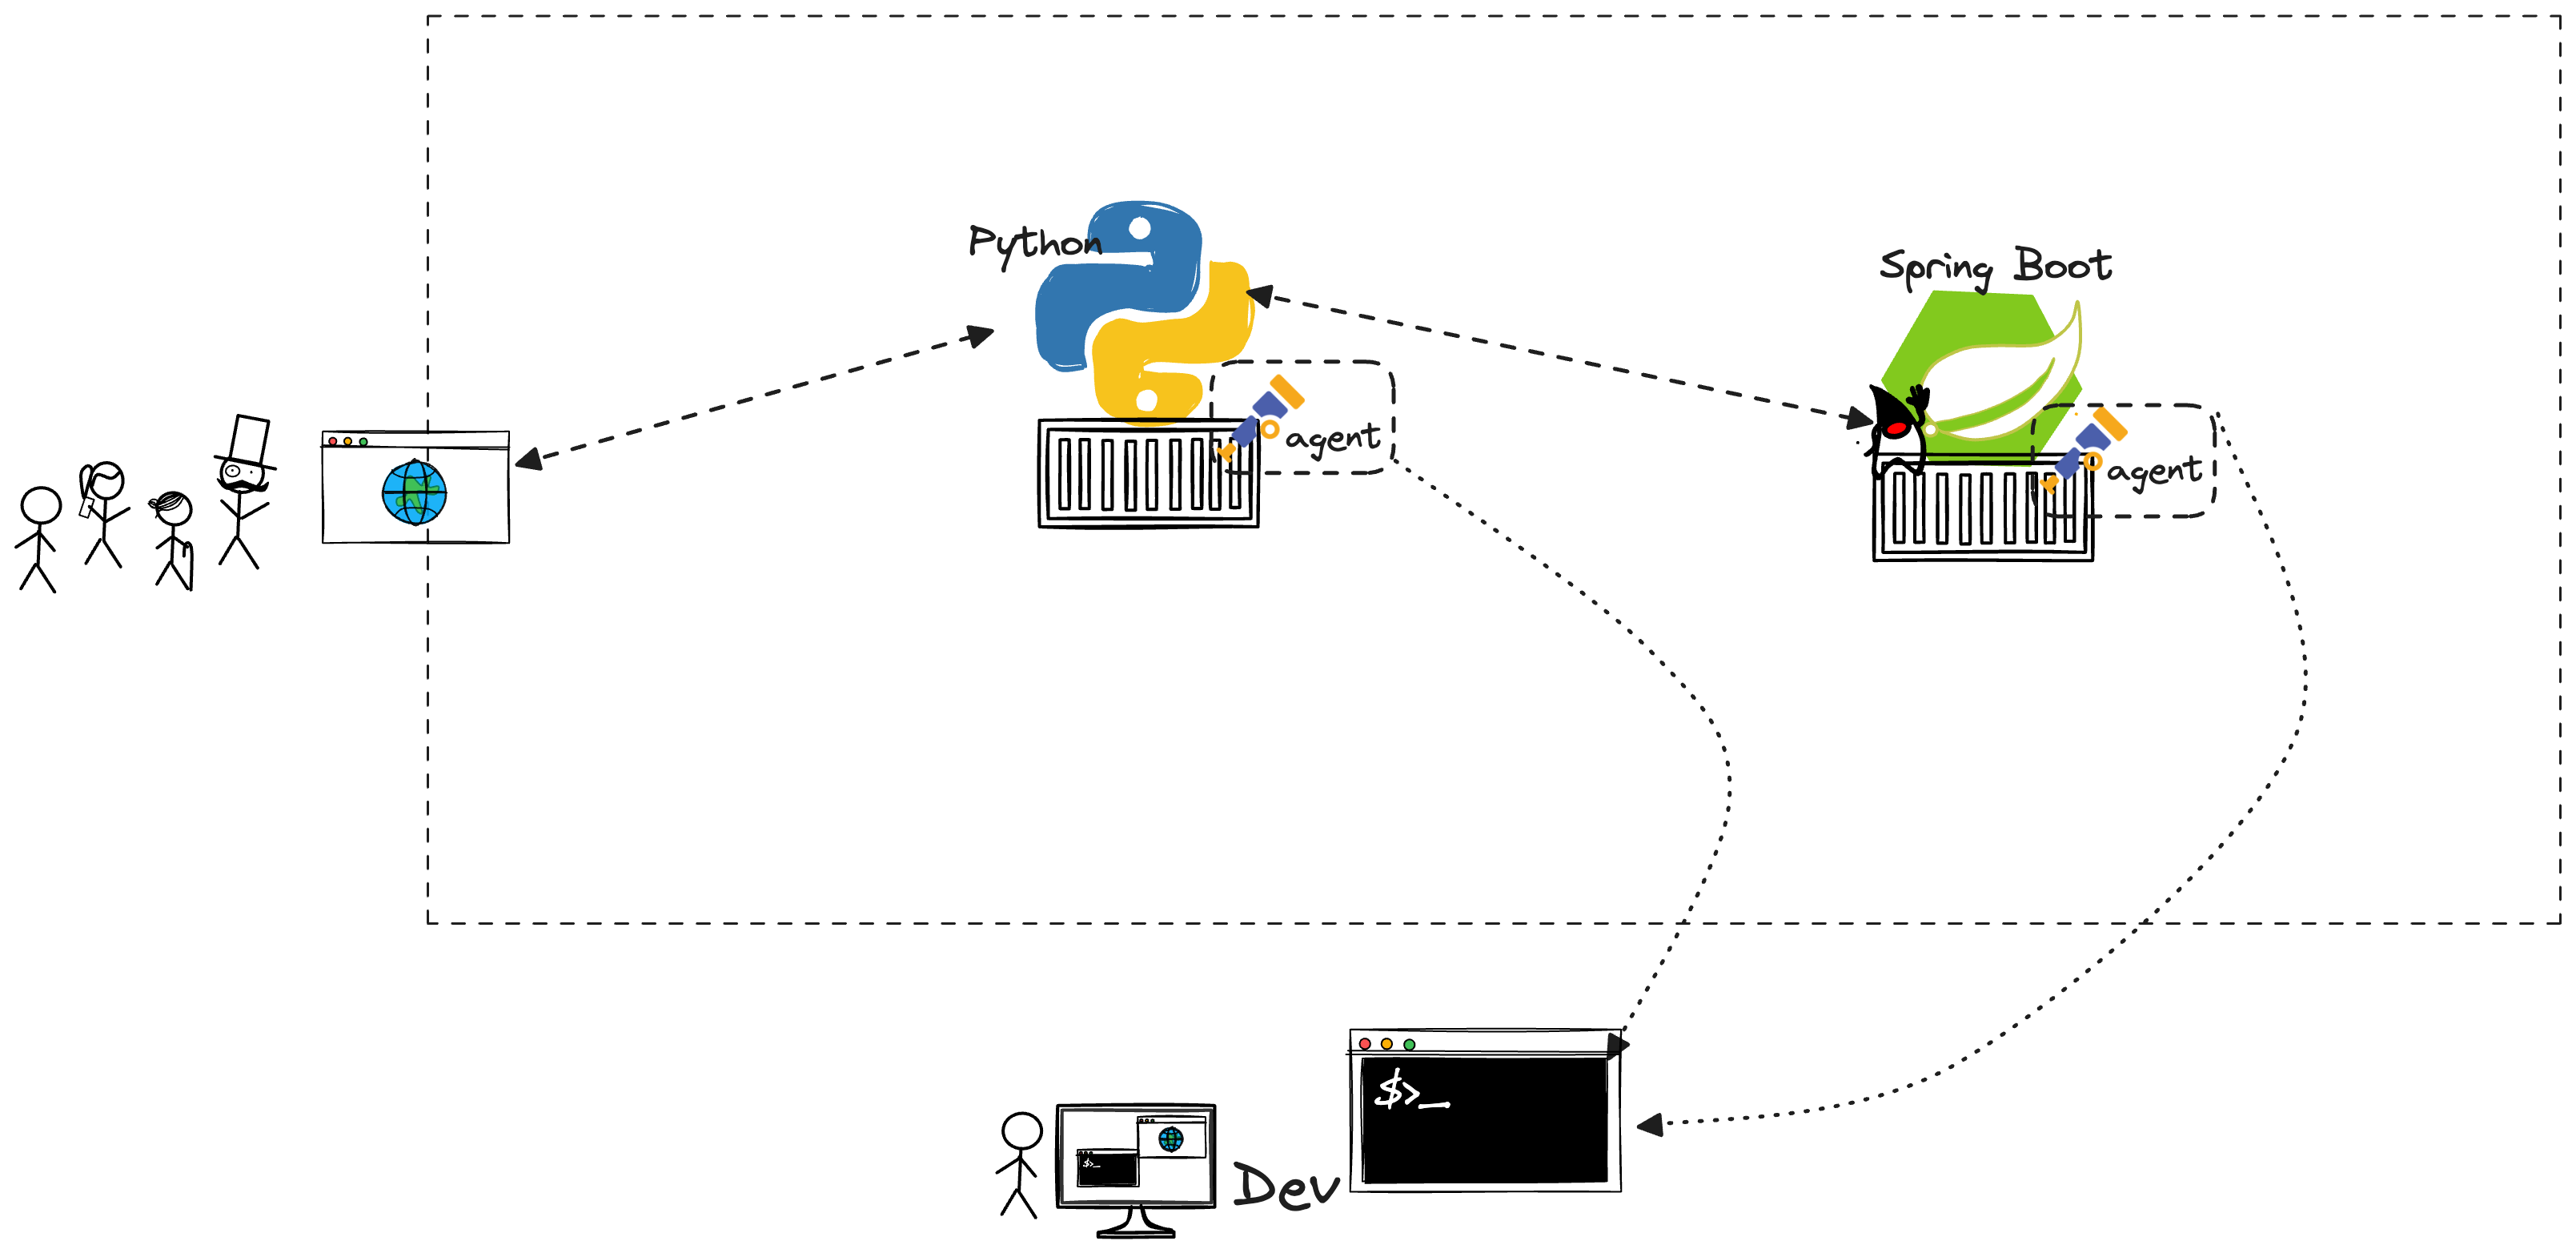
OpenTelemetry export to console
To achieve this, set the following environment variables:
export OTEL_TRACES_EXPORTER=console

export OTEL_METRICS_EXPORTER=none

export OTEL_LOGS_EXPORTER=none
This basically means that you tell the agent to only export trace information and to not try to reach out to a collector.
Now let’s try again to run the application with the latest settings using:
java -javaagent:./opentelemetry-javaagent.jar -jar target/todobackend-0.0.1-SNAPSHOT.jarThe errors from the previous run should now disappear and you can see trace information in your console output. It might be difficult to spot on the first try, but there are outputs like:
[otel.javaagent 2024-04-17 06:56:40:731 +0200] [main] INFO io.opentelemetry.exporter.logging.LoggingSpanExporter - 'CREATE table testdb' : e9bdebdf58d227cdbb8f9f9f406ebd82 b657cfe82cc88e3b CLIENT [tracer: io.opentelemetry.jdbc:2.3.0-alpha] AttributesMap{data={db.operation=CREATE table, db.name=testdb, thread.name=main, thread.id=1, db.user=sa, db.connection_string=h2:mem:, db.system=h2, db.statement=create table todo (todo varchar(?) not null, primary key (todo))}, capacity=128, totalAddedValues=8}This one is coming from the JDBC library for OpenTelemetry where you can see the SQL statements how Spring Boot initializes the database.
Congratulations. At this point you have successfully configured your Java app with OpenTelemetry!
Please let the application run within this terminal window and open another terminal. In the new terminal execute a request against the application using:
curl localhost:8080/todos/You should simply see an output like:
[]This is just because there are no items stored in your application.
If you switch back to the terminal of the Java application process you should see plenty of information in your console output.
[otel.javaagent 2024-04-17 07:04:57:384 +0200] [http-nio-8080-exec-1] INFO io.opentelemetry.exporter.logging.LoggingSpanExporter - 'SELECT testdb.todo' : 22571b7a308941882c3d203a2c1b2179 fcabde9f56343650 CLIENT [tracer: io.opentelemetry.jdbc:2.3.0-alpha] AttributesMap{data={db.operation=SELECT, db.sql.table=todo, db.name=testdb, thread.name=http-nio-8080-exec-1, thread.id=44, db.user=sa, db.connection_string=h2:mem:, db.system=h2, db.statement=select t1_0.todo from todo t1_0}, capacity=128, totalAddedValues=9}
[otel.javaagent 2024-04-17 07:04:57:387 +0200] [http-nio-8080-exec-1] INFO io.opentelemetry.exporter.logging.LoggingSpanExporter - 'SELECT io.novatec.todobackend.Todo' : 22571b7a308941882c3d203a2c1b2179 8a64843c1fb5217d INTERNAL [tracer: io.opentelemetry.hibernate-6.0:2.3.0-alpha] AttributesMap{data={thread.name=http-nio-8080-exec-1, thread.id=44}, capacity=128, totalAddedValues=2}
[otel.javaagent 2024-04-17 07:04:57:397 +0200] [http-nio-8080-exec-1] INFO io.opentelemetry.exporter.logging.LoggingSpanExporter - 'Transaction.commit' : 22571b7a308941882c3d203a2c1b2179 a5b7712f0edab44e INTERNAL [tracer: io.opentelemetry.hibernate-6.0:2.3.0-alpha] AttributesMap{data={thread.name=http-nio-8080-exec-1, thread.id=44}, capacity=128, totalAddedValues=2}
[otel.javaagent 2024-04-17 07:04:57:397 +0200] [http-nio-8080-exec-1] INFO io.opentelemetry.exporter.logging.LoggingSpanExporter - 'TodoRepository.findAll' : 22571b7a308941882c3d203a2c1b2179 0463a11569155a8d INTERNAL [tracer: io.opentelemetry.spring-data-1.8:2.3.0-alpha] AttributesMap{data={thread.name=http-nio-8080-exec-1, code.namespace=io.novatec.todobackend.TodoRepository, thread.id=44, code.function=findAll}, capacity=128, totalAddedValues=4}
2024-04-17T07:04:57.397+02:00  INFO 79699 --- [springboot-backend ] [nio-8080-exec-1] i.n.todobackend.TodobackendApplication   : GET /todos/ []
[otel.javaagent 2024-04-17 07:04:57:422 +0200] [http-nio-8080-exec-1] INFO io.opentelemetry.exporter.logging.LoggingSpanExporter - 'GET /todos/' : 22571b7a308941882c3d203a2c1b2179 61a3089ef357ce36 SERVER [tracer: io.opentelemetry.tomcat-10.0:2.3.0-alpha] AttributesMap{data={url.path=/todos/, thread.id=44, network.peer.address=0:0:0:0:0:0:0:1, server.address=localhost, client.address=0:0:0:0:0:0:0:1, http.response.status_code=200, http.route=/todos/, server.port=8080, http.request.method=GET, url.scheme=http, thread.name=http-nio-8080-exec-1, user_agent.original=curl/8.4.0, network.protocol.version=1.1, network.peer.port=52219}, capacity=128, totalAddedValues=14}
You can see multiple statements of the otel.javaagent but if you take a closer look each of them is originating from a different tracer library. You may spot jdbc, hibernate, spring data and tomcat.
This is how the auto-instrumentation works here. It uses a collection of instrumentation library to trace default components, which the Java application uses here.
However, it makes another problem obvious: There are many spans being collected and it is hard to read on the console with the human eye.
If you execute another curl call in your other shell to add a new item, e.g.
curl -X POST localhost:8080/todos/NEWyou will get a whole set of entries including the one with the INSERT statement.
[otel.javaagent 2024-04-17 07:12:33:886 +0200] [http-nio-8080-exec-2] INFO io.opentelemetry.exporter.logging.LoggingSpanExporter - 'INSERT testdb.todo' : 4877d4bdd961fbf220a98aa4a9cda57b b97f57f46d6b96e1 CLIENT [tracer: io.opentelemetry.jdbc:2.3.0-alpha] AttributesMap{data={db.operation=INSERT, db.sql.table=todo, db.name=testdb, thread.name=http-nio-8080-exec-2, thread.id=45, db.user=sa, db.connection_string=h2:mem:, db.system=h2, db.statement=insert into todo (todo) values (?)}, capacity=128, totalAddedValues=9}We can make our lives easier here and export the information to a visualisation tool like Jaeger.
First stop the application again using Ctrl+C.
Now deploy an all-in-one option of the Jaeger application, which comes with a bundled OpenTelemetry collector:
docker run -d --name jaeger \
  -e COLLECTOR_OTLP_ENABLED=true \
  -p 16686:16686 \
  -p 14268:14268 \
  -p 4317:4317 \
  -p 4318:4318 \
  jaegertracing/all-in-one:1.57
This will put the process into the background. Make sure it is up and running using
docker pswhich should include a container called jaeger
CONTAINER ID   IMAGE                      COMMAND                  CREATED         STATUS         PORTS                                                                                                                                          NAMES
65efd5788ad6   jaegertracing/all-in-one   "/go/bin/all-in-one-…"   7 seconds ago   Up 6 seconds   5775/udp, 5778/tcp, 9411/tcp, 0.0.0.0:4317-4318->4317-4318/tcp, 0.0.0.0:14268->14268/tcp, 0.0.0.0:16686->16686/tcp, 6831-6832/udp, 14250/tcp   jaeger
To make sure the information will be sent to the right endpoint, reconfigure the environment variable from before:
export OTEL_TRACES_EXPORTER=otlpwe could additionally configure the location of the Collector by specifying:
export OTEL_COLLECTOR_HOST=localhostThis is however the default anyway, so we can skip that. Also we don’t need to configure port as per default 4317 is being used for gRPC and 4318 for HTTP. The agent will try to look for it and of course complain if it can’t reach it.
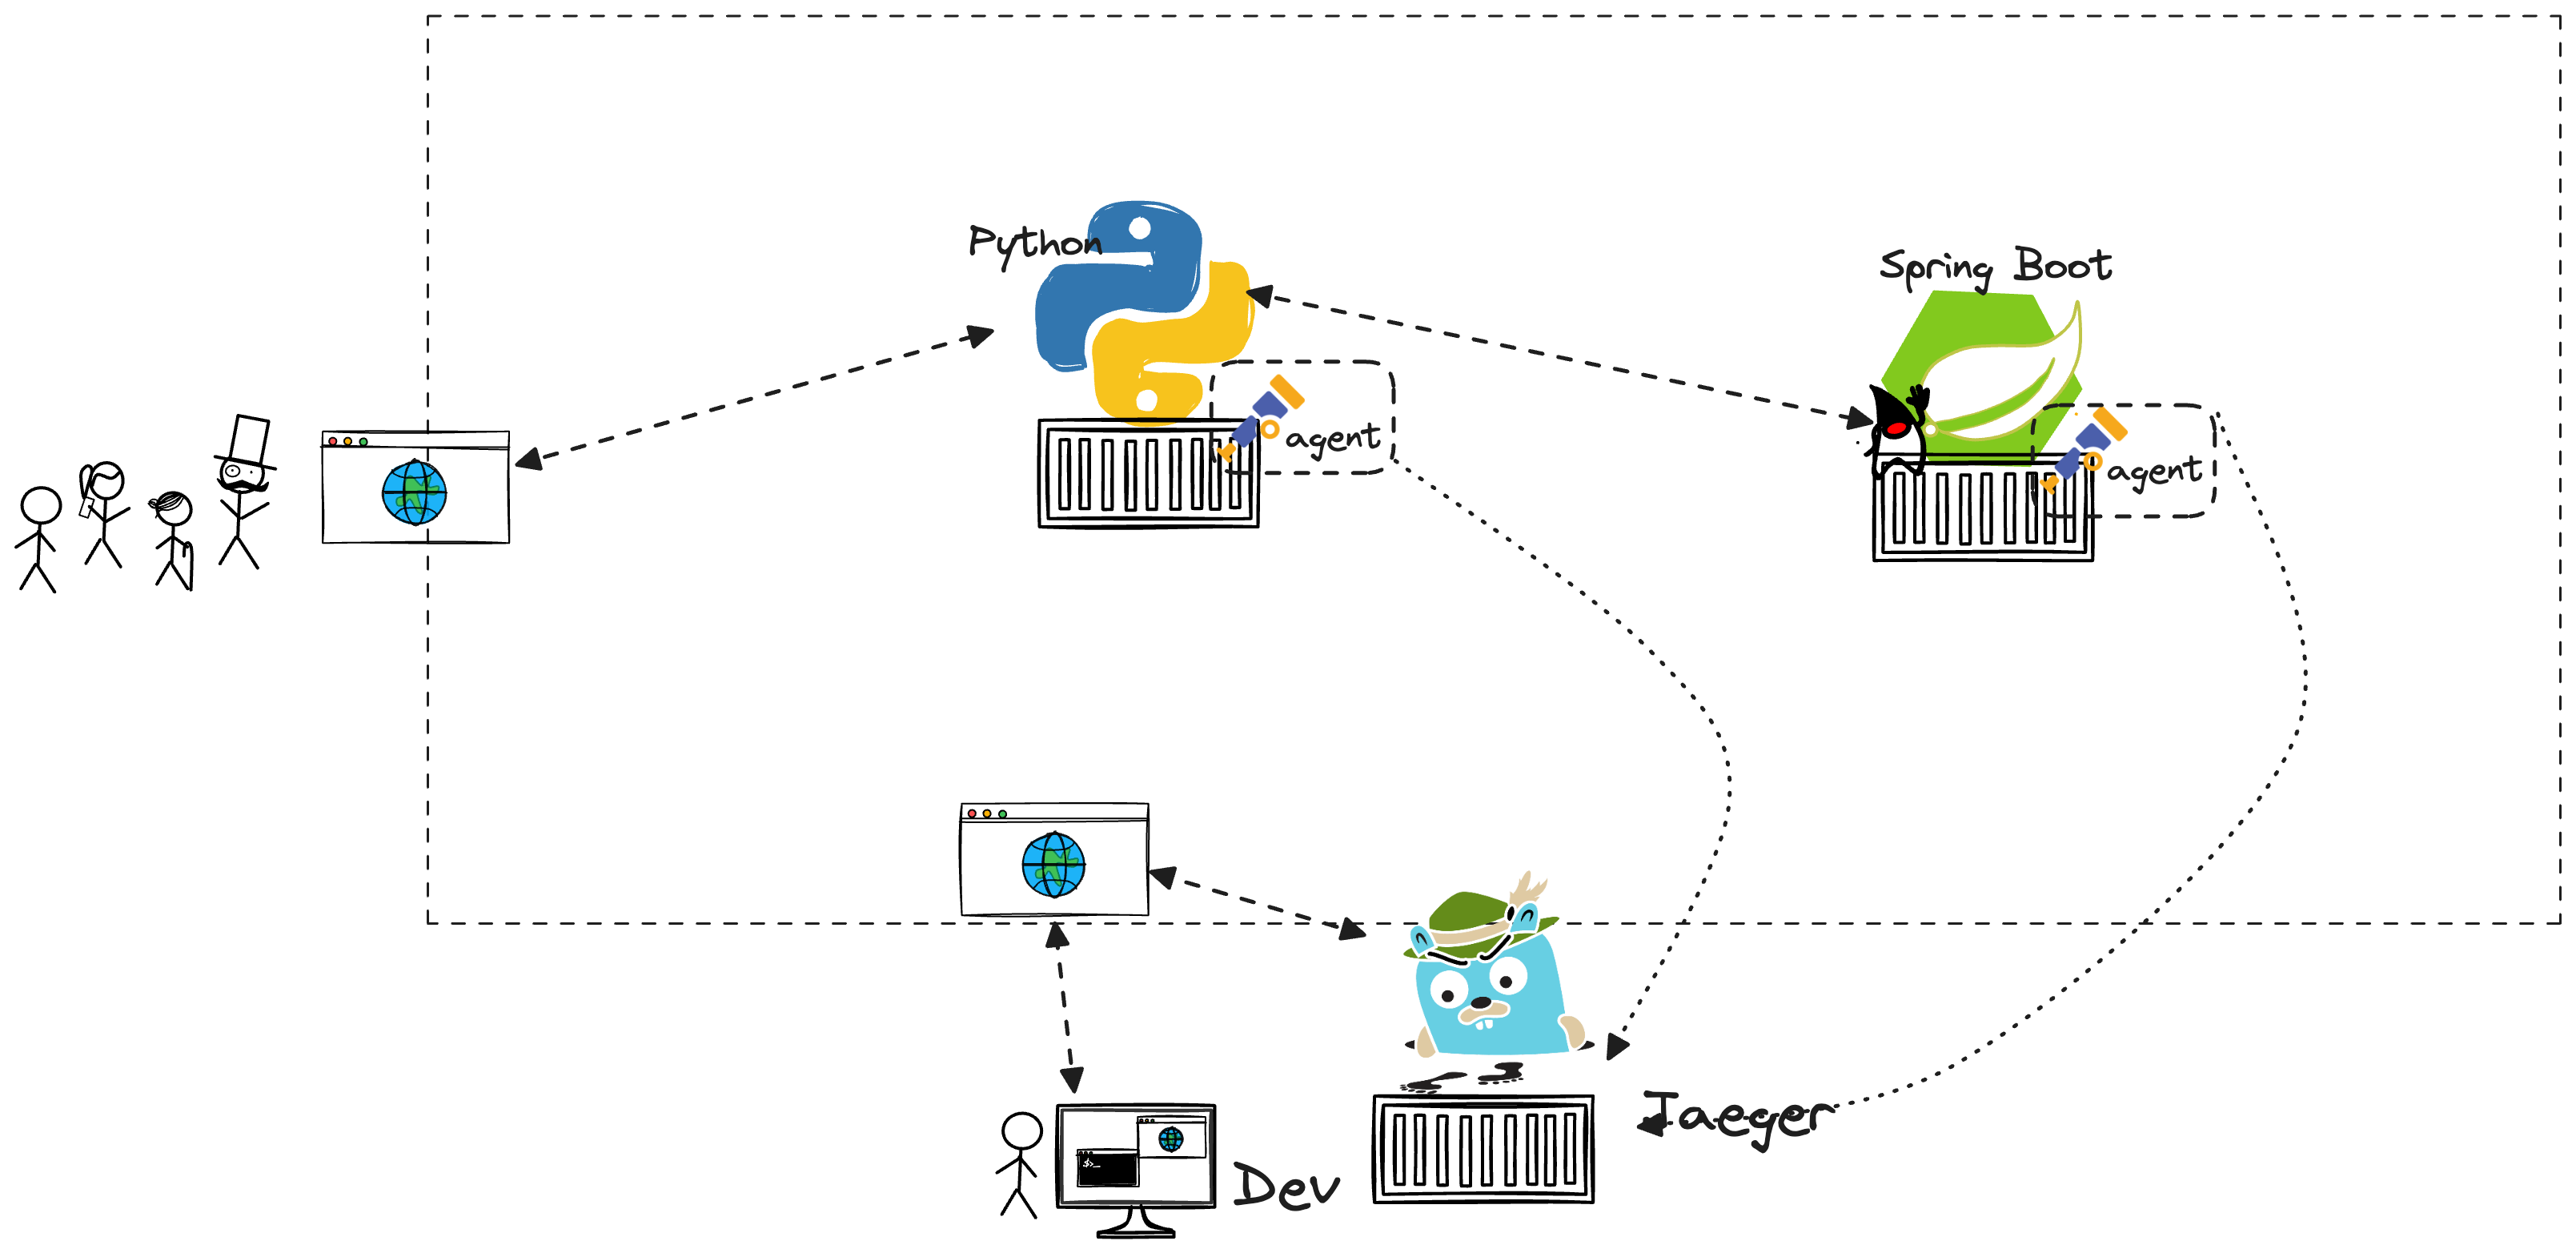
OpenTelemetry export to Jaeger
Run the Java application again:
java -javaagent:./opentelemetry-javaagent.jar -jar target/todobackend-0.0.1-SNAPSHOT.jarYou may already notice that there is less output in the console despite the agent being present.
In your second terminal execute this command again:
curl -X POST localhost:8080/todos/NEWNow point your browser to http://localhost:16686/.
If you run your application with a local container daemon, localhost in your browser will work. If you are using a cloud-based setup like Codespaces or Gitpod , please see the section “How to use this lab”.
Especially the section about ports and hostnames is relevant here. Link
The Jaeger UI will come up. Click the button Find traces.
Please refer to the chapter “OpenTelemetry in Action” for steps how to navigate within
Click on a trace in the list that shows a certain number of spans,
e.g. the POST /todos/ or GET /todos/` one.
You will get a breakdown of the spans which you saw before in the console output. Jaeger has them neatly arranged, so you can expand and basically walk through the call stack.
If you want to simulate a slow performing call you can execute:
curl -X POST localhost:8080/todos/slowYou can observe the different behaviour in the Jaeger console.
If you are familiar with Java you can of course also look at the code in the folder: src/main/java/io/novatec/todobackend
Open the TodobackendApplication.java with your VS Code built-in editor.
Excursus - Configuration of Java agent
The OpenTelemetry Java agent provides a vast amount of features out of the box and normally requires no further configuration.
Nevertheless, it provides several configuration properties to adapt its behaviour to your needs.
Those properties can be set via -D flags, environment variables (as seen above) or properties file,
which can be referenced with otel.javaagent.configuration-file.
Below we will explain some useful agent properties.
There is a properties file in the resources directory, which can be used to test some configuration properties.
Run the following command to start the Java application with the configuration file:
java -javaagent:./opentelemetry-javaagent.jar \
  -Dotel.javaagent.configuration-file=src/main/resources/otel-config.properties \
  -jar target/todobackend-0.0.1-SNAPSHOT.jar
Note, when changing the otel-config.properties file, you have to restart the application for the changes to take effect.
Debugging
When experimenting with the Java agent, it is always helpful to get more detailed insights from the agent.
Thus, you can enable the debug logs by setting otel.javaagent.debug to true.
Limiting instrumentation
The Java agent contains a large amount of instrumentation modules for different technologies.
Sometimes we would like to include only specific modules and disable everything else, for instance to save resources.
The agent allows us to disable the auto instrumentation completely by setting
otel.instrumentation.common.default-enabled to false. Then, you can include each module individually by setting
otel.instrumentation.[module-name].enabled to true. You can find the list of all default module names in the
documentation.
Creating additional spans
Each instrumentation module includes only a specific set of methods, which will be instrumented.
If you would like to instrument additional methods to create more detailed traces of your application,
you can use the property otel.instrumentation.methods.include.
This property expects a list of methods, which are defined like this:
io.novatec.todobackend.TodobackendApplication[someInternalMethod, anotherMethod];io.another.Application[method]
Later, we will learn about the @WithSpan annotation, which behaves similarly.
Capturing HTTP information
You can easily include additional information from HTTP headers to your spans. This allows you to extend the existing HTTP instrumentation. There are several properties depending on whether your application acts as a client or server and whether you would like to read the headers from requests or responses:
otel.instrumentation.http.client.capture-request-headersotel.instrumentation.http.client.capture-response-headersotel.instrumentation.http.server.capture-request-headersotel.instrumentation.http.server.capture-response-headers
All properties expect a comma-separated list of HTTP header names, which should be read and written into span attributes.
Agent extensions
The Java agent provides an extension API, which allows you to extend its behaviour with your custom logic. This also allows you to extend the instrumentation without changing the application codebase. For instance, you would like to collect business data with the Java agent. Since the agent itself doesn’t know your business logic, you can include your extension to capture such data.
An extension resembles an additional JAR file, which has to be referenced via otel.javaagent.extensions.
There are some example for such extensions in GitHub.
Take a look at the OpenTelemetry documentation to learn more about the agent configuration.
Instrumentation of the Python (Flask) component
Now that we have successfully auto-instrumented the Java part of the application, let’s focus how to achieve similar results with the Python part. Leave the docker container and the Java part from the previous step up und running, we still need it now.
Open a new terminal window/tab and within this one switch to the directory where the Python code is located. (automatic-instrumentation/initial/todoui-flask)
cd $EXERCISES
cd automatic-instrumentation/initial/todoui-flask
Let’s run the application in non-instrumented mode and validate everything works as expected.
Simply run:
python app.pyYou should now be able to access the frontend in the browser (http://localhost:5000). Try to add and remove a few todos and see, if the behaviour is consistent with the exercises from the OpenTelemetry in Action chapter. Also access the Jaeger UI (http://localhost:16686) and see, if you can observe traces. If one of the web pages is not accessible or shows errors, make sure the docker container and Java component from the previous exercise instrumentation of the Java (Spring Boot) component are up and running.
Once the correct behaviour is validated stop the Python app again using Ctrl+C in the terminal window where it has been executed.
We’re all set to start with the auto-instrumentation. In the Python case we don’t download an agent library, but need to make sure some OpenTelemetry packages for Python are installed.
Execute:
pip install opentelemetry-distro opentelemetry-exporter-otlpWait for the command to finish. All necessary dependencies are now in place.
Now run the following command to enable the auto-instrumented invocation of Python apps.
opentelemetry-bootstrap --action=installFor the current version we are facing a bug here and temporarily need to do this step:
pip uninstall opentelemetry-instrumentation-aws-lambdaAs a final step we need to set some environment variables - almost identical to the Java part. They will configure the behaviour of the instrumented app and make it send only trace metrics to the OpenTelemetry collector.
Execute the whole block in one step:
export OTEL_LOGS_EXPORTER="none"
export OTEL_METRICS_EXPORTER="none"
export OTEL_TRACES_EXPORTER="otlp"
export OTEL_EXPORTER_OTLP_ENDPOINT="localhost:4317"
export OTEL_SERVICE_NAME=todoui-flask
export OTEL_EXPORTER_OTLP_INSECURE=true
Instead of running the application using the standard python or flask command we now place a new script in front of it.
This script is called opentelemetry-instrument and is a result of the just executed opentelemetry-bootstrap --action=install call.
Execute the call like this:
opentelemetry-instrument python app.pyThe output will look exactly like the non-instrumented application.
 * Serving Flask app 'app'
 * Debug mode: off
INFO:werkzeug:_internal:WARNING: This is a development server. Do not use it in a production deployment. Use a production WSGI server instead.
 * Running on all addresses (0.0.0.0)
 * Running on http://127.0.0.1:5000
 * Running on http://172.17.0.2:5000
INFO:werkzeug:_internal:Press CTRL+C to quit
Now access the Python Web UI, add and remove some todos.
After that switch to the Jaeger Web UI. Once you refresh the http://localhost:16686/search URL, you can now see that 3 services have been captured with trace information. On the drop-down menu, you can see that todoui-flask component has been added. Feel free to play around with the list and observe the results in Jaeger.
Recap: Benefits and limitations of auto-instrumentation
A major advantage of dynamically attaching instrumentation at runtime is that we don’t have to make modifications to the application’s source code. Auto-instrumentation provides a great starting point when trying to instrument an existing application. The observability insights it provides are sufficient for many, while avoiding the significant time investment and understanding of OpenTelemetry’s internals that is required with manual instrumentation. However, as you might have guessed, it is not a magic bullet as there are inherent limitations to what auto-instrumentation can do for us. Building on top of instrumentation libraries, auto-instrumentation inherently capture telemetry data at known points in a library or framework. These points are deemed interesting from an observability perspective because they relate to actions such an incoming HTTP request, making a database query, etc.