Logs
How to perform the exercise
- You need to either start the repository with Codespaces, Gitpod or clone the repository with git and run it locally with dev containers or docker compose
- Initial directory:
exercises/manual-instrumentation-logs/initial - Solution directory:
exercises/manual-instrumentation-logs/solution - Source code:
exercises/manual-instrumentation-logs/initial/src - How to run the application either:
- Run the task for the application:
Run manual-instrumentation-logs initial application(runs the Python application) - Run the application with Terminal commands
python3 src/app.py(runs the Python application)
- Run the task for the application:
- Start the echo server with
docker compose up -d- If another instance of the echo server is already running, you can also use the existing instance
How did we get here
Logs are one of the main pillars of observability and part of the MELT acronym (Logs, Metrics, Traces and Events) and is therefore incredibly important to determine the behavior and health of a system. Logs have the longest legacy among all the signals. For decades simple instructions were used to print debug output to files or stdout like System.out.println("Hello, World!") in Java, print('Hello, World!') in Python or the println!("Hello, World!") Macro in Rust. Thereby Logs can represent any data you want. It could be structured data like JSON
{
  "app": "example-app",
  "level": "debug",
  "message": "started example-app in 453ms",
  "timestamp": 1706876665982232832
}
or it could be unstructured data like a string, that signals which function call your program just entered.
entered function example_functionWith the increase in complexity of computer programs, especially with the introduction of distributed systems, just printing any data to a file or stdout wasn’t going to cut it anymore. Also, printing every debug statement to a file could accumulate large amounts of data, which could decrease available disk space and, in the worst-case, use up all the available disk space, which leads to crashes in the system. Frameworks, like Log4j, emerged that assisted the developer in creating more structured logs with including logging levels (Trace, Debug, Info, Warn, Error, Fatal), that could roughly filter log data, or automatically add data to enrich the log entries with essential data, like timestamps or the name of the class that created an entry. A log entry like this can, for example, be found in Spring Boot applications running in Docker:
example-app | 2024-02-02 12:06:49.335 INFO 1 --- [main] w.s.c.ServletWebServerApplicationContext : Root WebApplicationContext: initialization completed in 837 msThis log entry adds metadata like the service name (Docker), a timestamp when the log entry was generated (Spring), a log level - in this case INFO, a context where the log was generated and in the end the log message.
With the rise of distributed systems and microservices, collecting the log entries just on the machine where the services were running has turned out to be impractical. So there was the need for log aggregation tools like fluentd, the ELK stack (Elasticsearch, Logstash, Kibana) or Grafana Loki. These tools can aggregate log entries from multiple sources to store these entries in a centralized solution. In the example, there are multiple containers deployed that run a log collector agent that sends log entries to a Grafana Loki instance. Loki stores the entries, indexes them and makes them queryable via LogQL. With LogQL logs, entries can then be explored with Grafana, where dashboards or alerts can be configured for the entries.
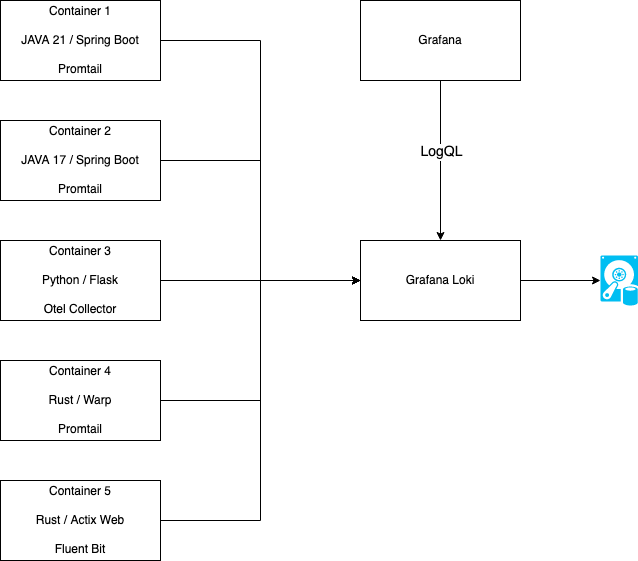
log aggregation
This enabled developers to perform indexing and searching to find failures and problems faster, run log analysis to find patterns or trends, monitor log entries to find anomalies or even trigger alerts or generate reports. This was a giant leap forward with using log entries in observability, but it still wasn’t perfect. If you tried to get more context like the call stack or other services, developers still needed to find the corresponding traces and spans by correlating the timestamp or IDs. Besides that, there are multiple formats for logs and multiple aggregators to collect the entries. Nothing is unified, and not every aggregator can read every logging format. This would lead to fragmentation and additional effort to integrate logging into the observability stack of an application.
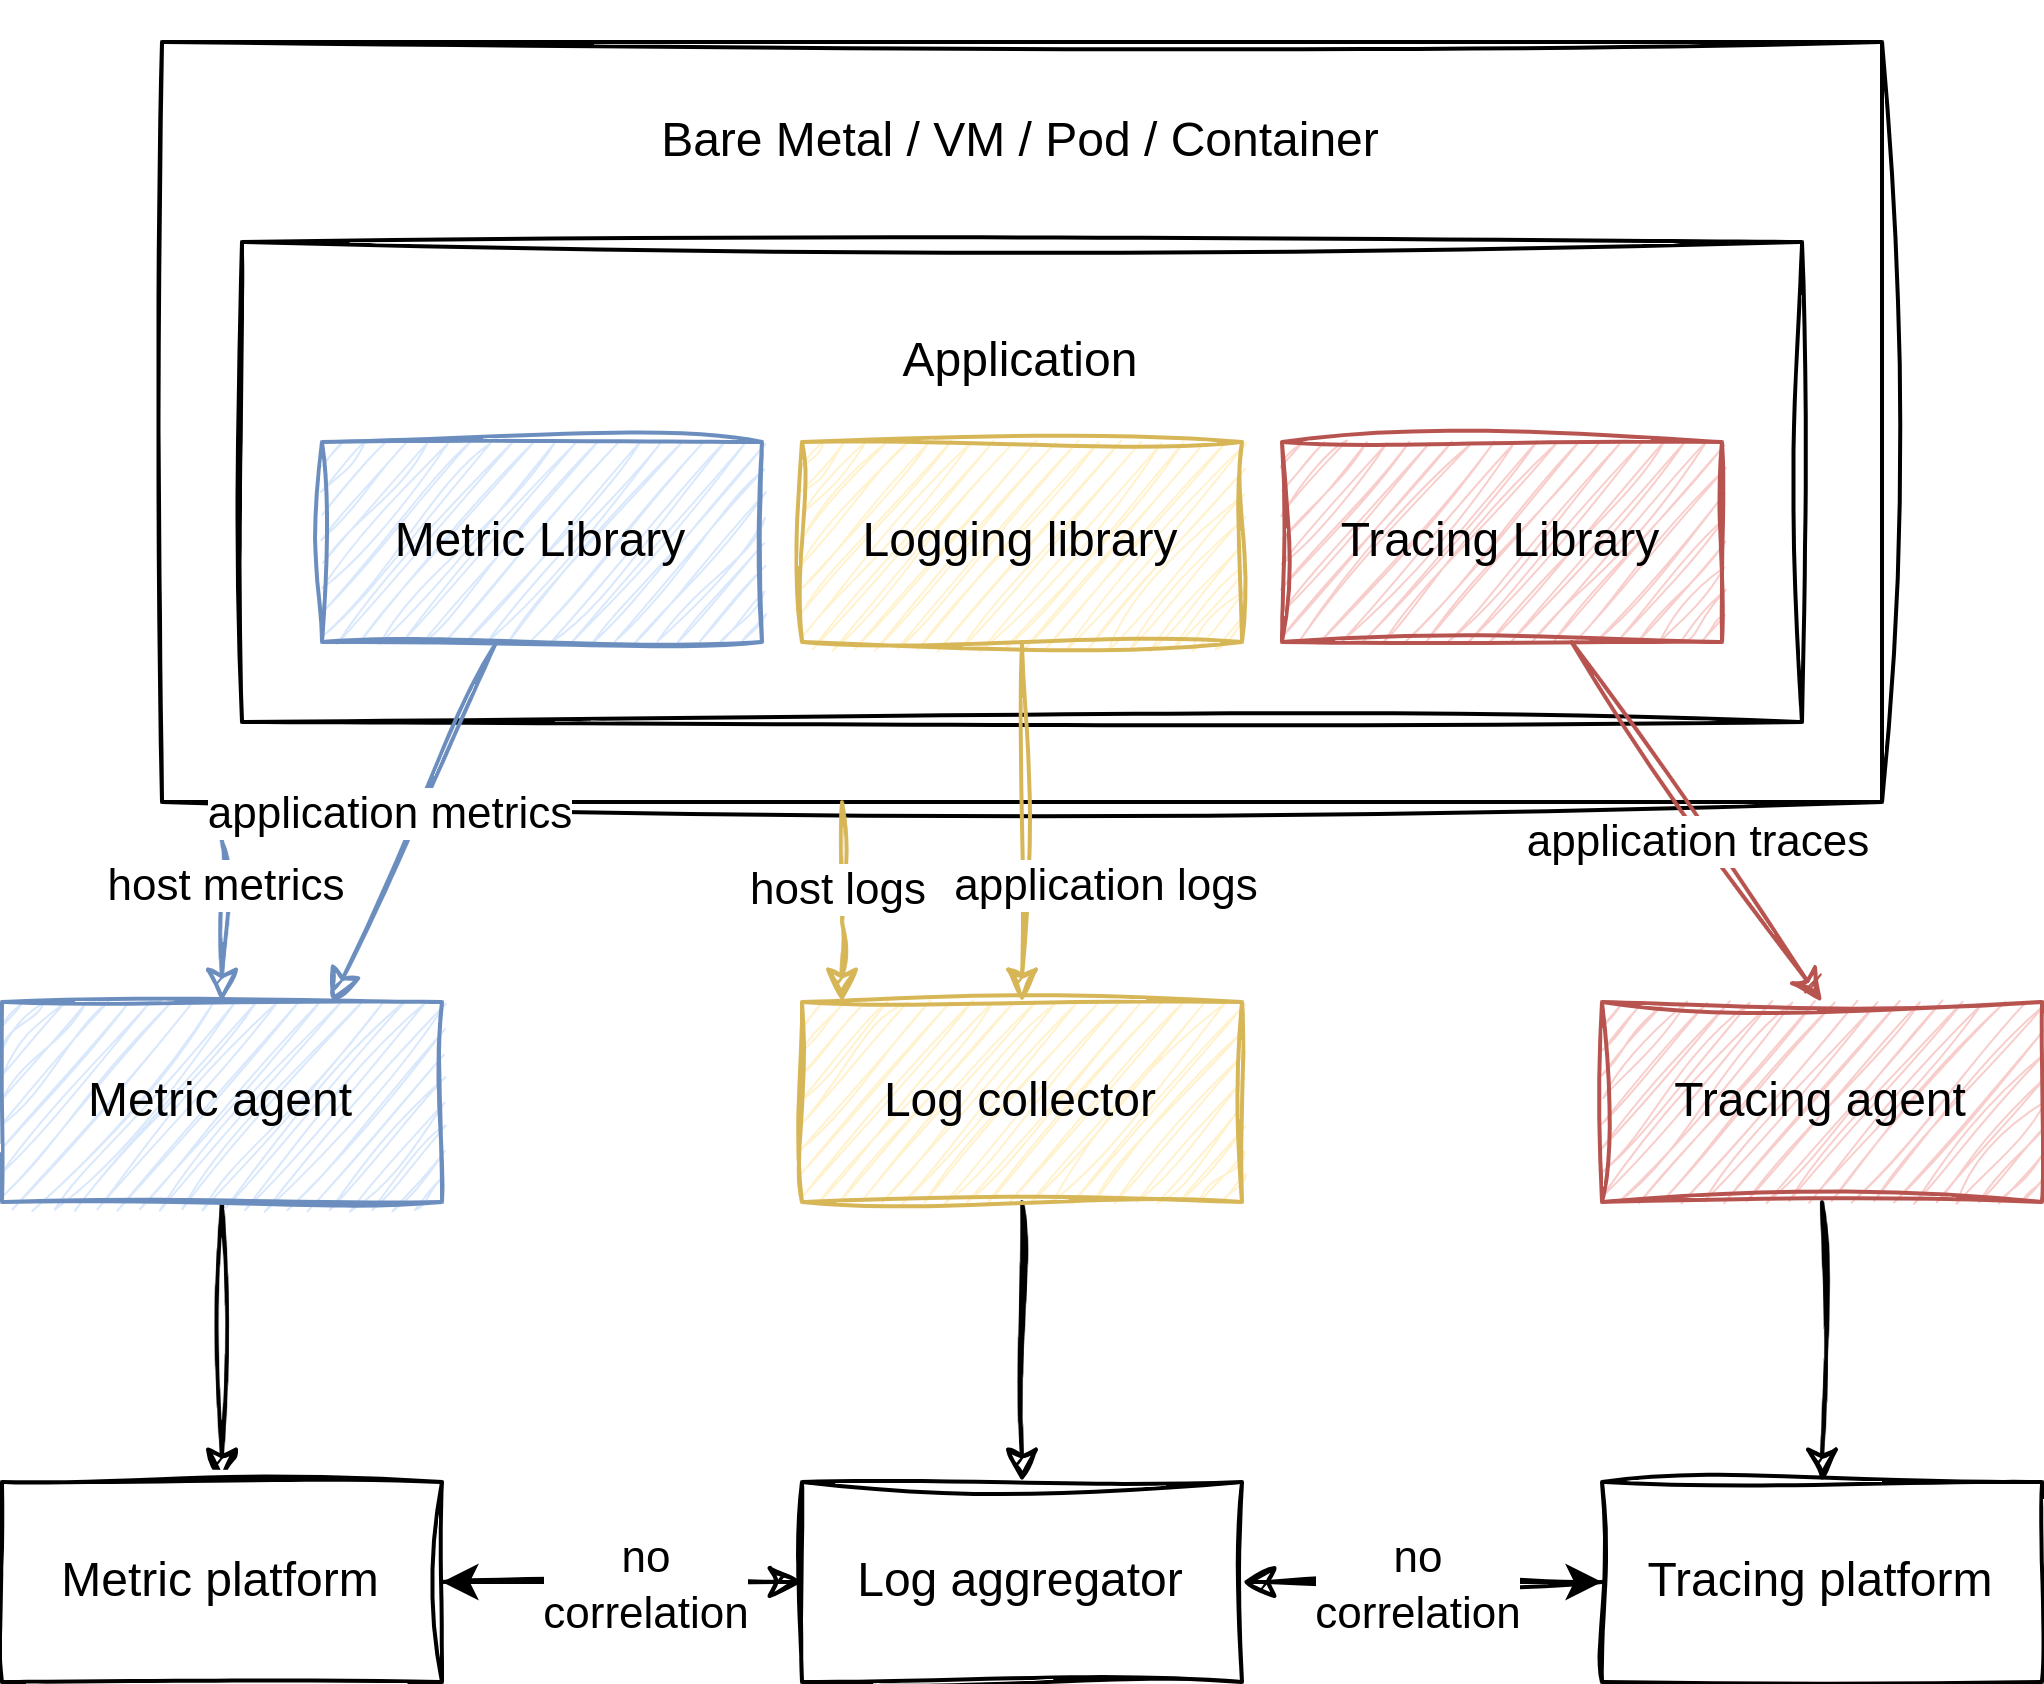
before OpenTelemetry
This is where the idea of OpenTelemetry Logging was born.
OpenTelemetry Logging
In OpenTelemetry every data that is neither a part of a distributed trace nor a metric is considered a log. For example, events are just specialized log entries.
Logging in OpenTelemetry differs a little from the other signals. Logging is not implemented from the ground up like traces and metrics, which are exposed in newly built APIs and are implemented in SDKs. It uses existing logging functionality from programming languages or existing logging libraries to integrate into. To accomplish that, OpenTelemetry exposes a Logs Bridge API that combines the existing logging solution with traces and metrics collected by OpenTelemetry or other components of OpenTelemetry. This API should not be used by application developers, as it should be provided by the logging solution. The logging solution should be configured to send log entries, also called LogRecord, into a LogRecordExporter. The logging solution can use the LoggerProvider factory to create new Logger instances that are initialized once and match the lifecycle of the application. The created logger is responsible for creating log entries. When logs are created, it’s the LogRecordExporters responsibility to send the log entries to a collector like the OpenTelemetry Collector. The log entry, which is of type LogRecord, consists of multiple fields like timestamp, traceId, spanId, severityText, body and some more, that will be discussed in the hands-on chapter.
The data model of OpenTelemetry logging is designed in such a way that existing data models can be mapped to the OpenTelemetry data model. Translating logging data from an arbitrary logging format into the data model and then translating it into another logging format should not be worse than translating the initial logging format directly to the other format. The data model aims to represent multiple types of logs, like system formats that are generated by the operating system like syslog, third-party applications like logs that generate Apache log files and first-party applications where developers can modify the logging format. OpenTelemetry defines in the specs which fields map to which type, and for some logging formats and libraries mappings are already defined. With the OpenTelemetry stack, a unified way to collect telemetry data is created. Since logs provide additional metadata, all the collected telemetry data can be correlated to each other. In the following chapter, this will be further demonstrated.
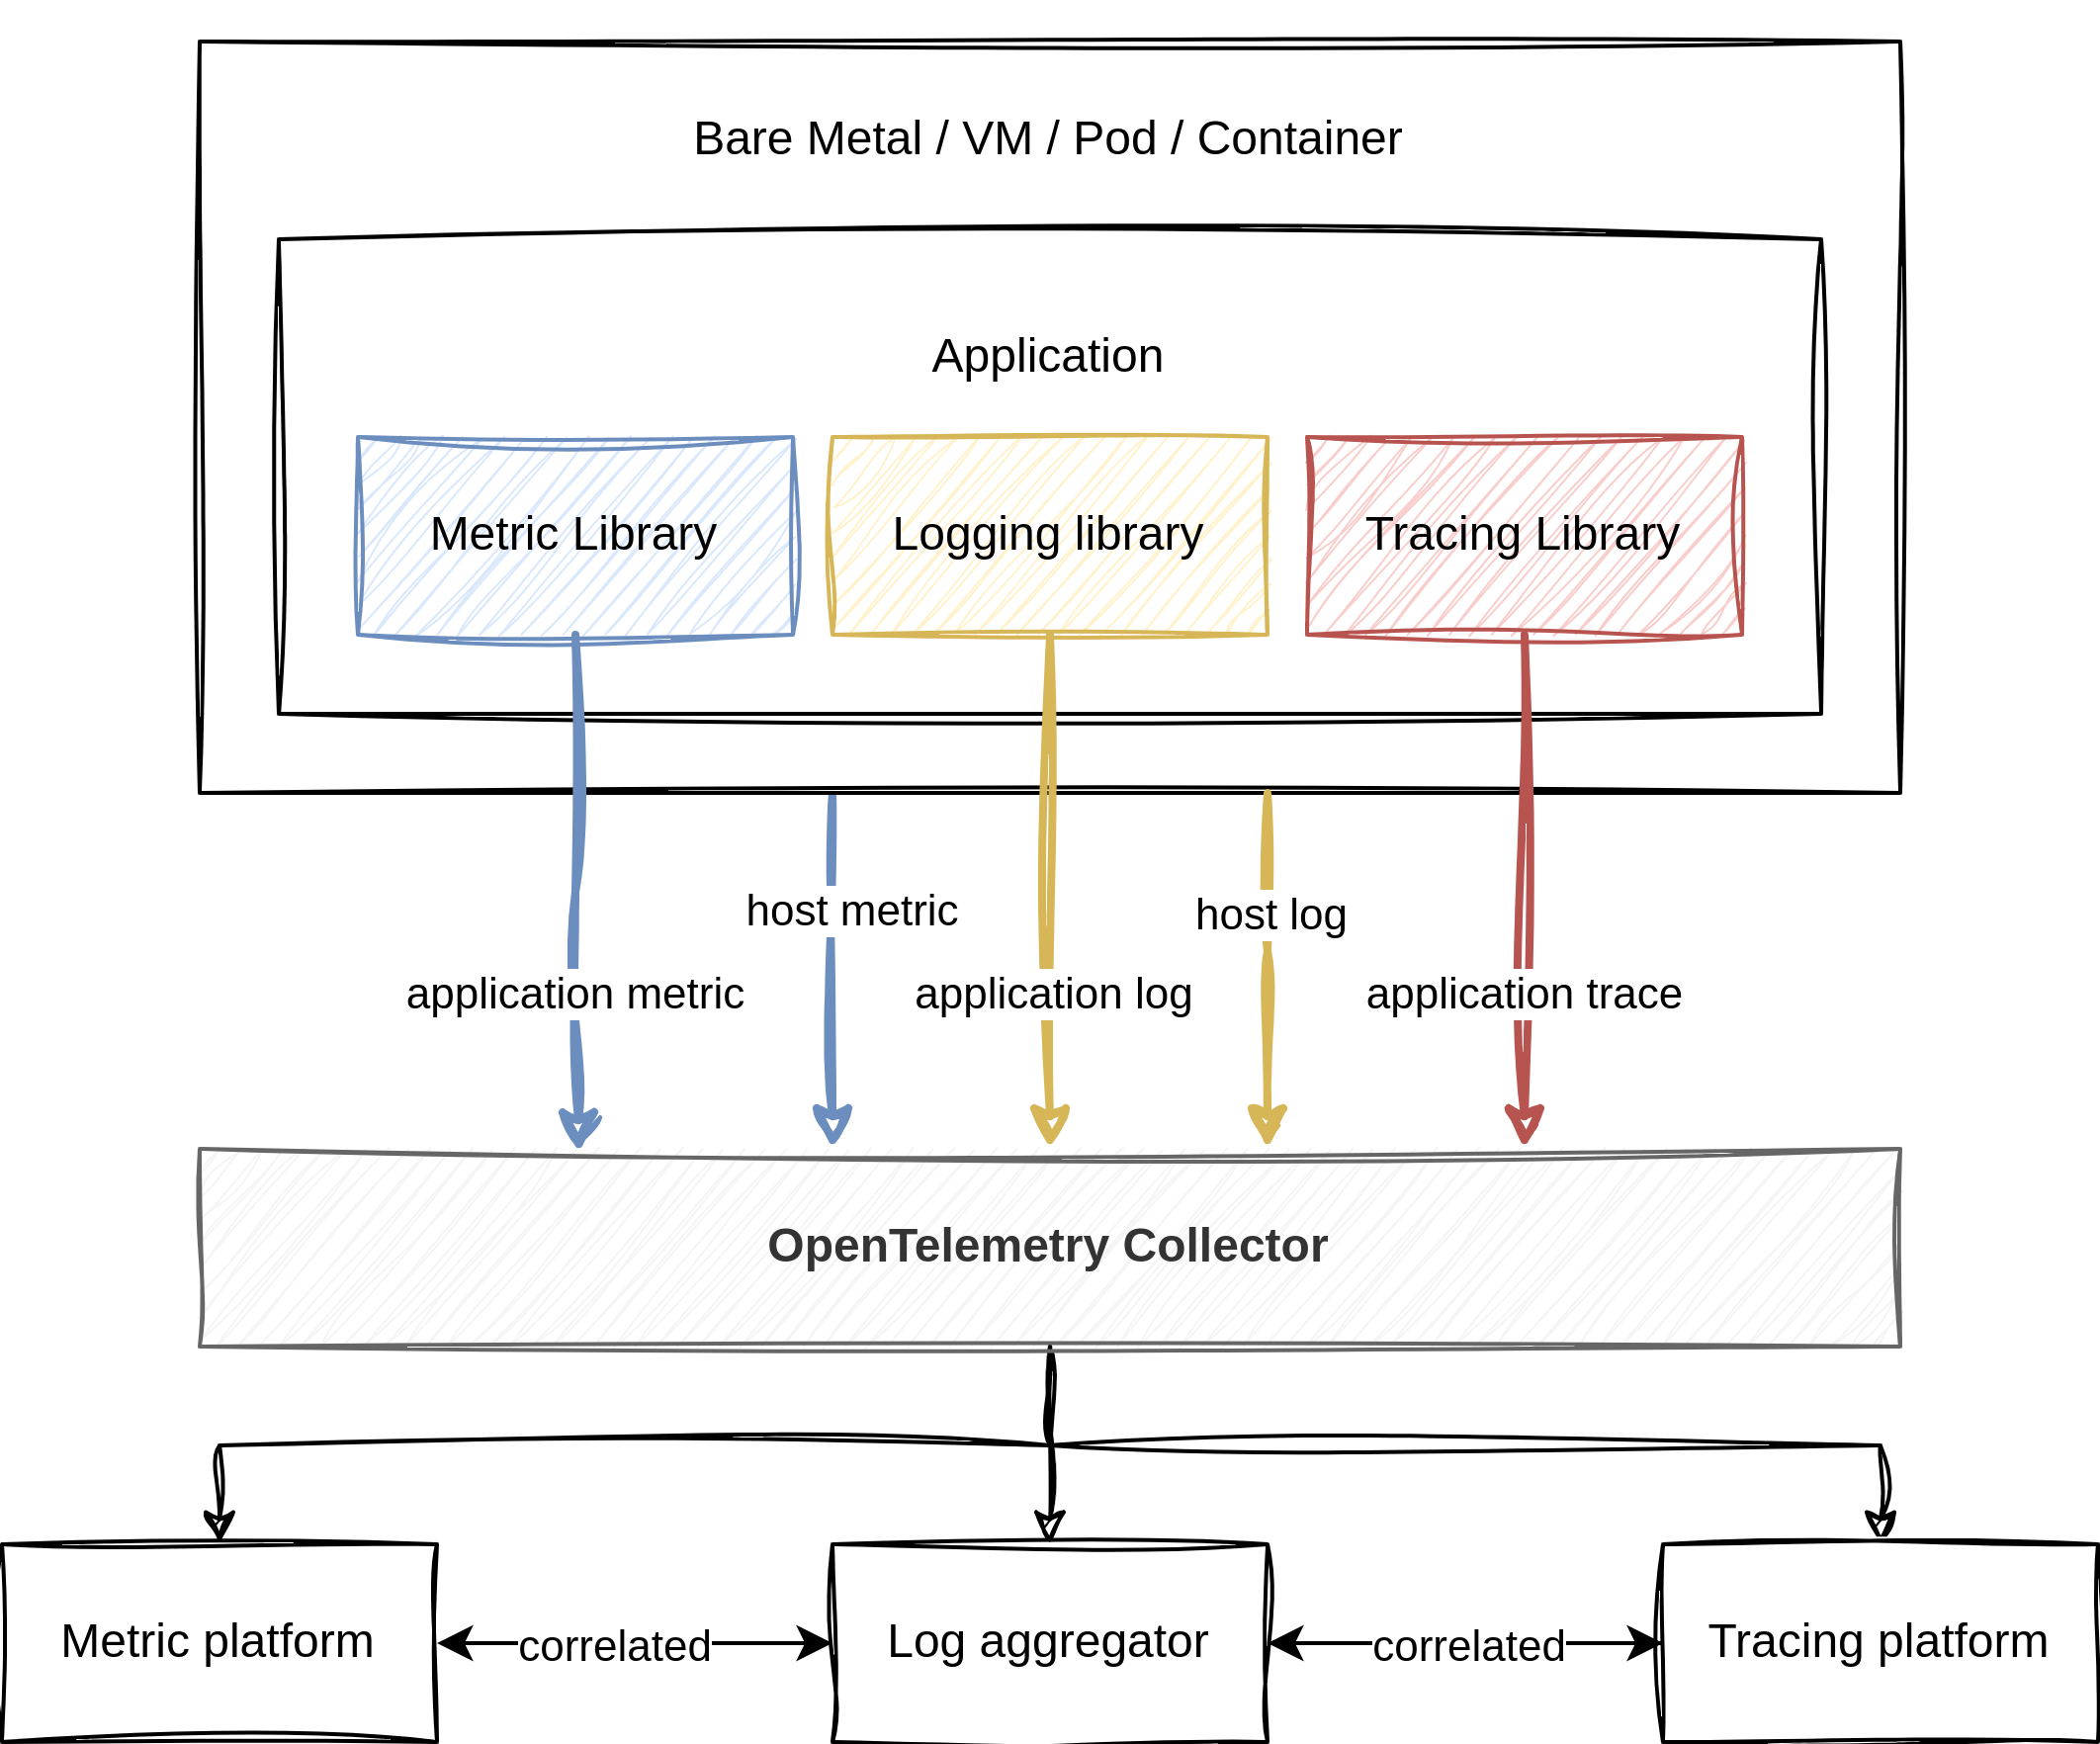
with OpenTelemetry
Hands-on
Now let’s start with some hand-on experience. The goal of this little demo-app is to show how to incorporate OpenTelemetry Logging into applications. To follow along the following steps, please open the course repository on the side and change the directory to exercises/manual-instrumentation-logs/initial. The session will start from there.
The starting point is the same app that was used in the metrics and traces lab.
First, we want to get an overview of logging in Python. Logging is mostly done via the integrated logging module. The module has several severity levels that are invoked by function calls to debug, info, warning, error and critical. These functions take anything as data, and the default behavior is to print messages to stdout.
Let’s start by adding the logging module into our main module. To do so, open app.py and insert import logging at the top of the module. To add a logging entry, add an info log entry in the index function with the info method of the logging module.
The function should look something like this:
@app.route("/", methods=["GET", "POST"])
def index():
    logging.info("Info from the index function")
    do_stuff()
    current_time = time.strftime("%a, %d %b %Y %H:%M:%S", time.gmtime())
    return f"Hello, World! It's currently {current_time}"
To test whether everything works, run the app via python src/app.py or via the play button in the top-right corner of VS Code. Now navigate to the index route of our web server at http://localhost:5000/. Look at the terminal output. There should be several log entries, but the info log is missing. That’s because by default, only log entries with severity warning and higher are displayed. To fix this, change logging.info to logging.warn - which would be semantically wrong, but it works. Or configure the logger to display other severity levels. To do so, add a statement to the top of app.py just under the imports.
logging.basicConfig(level=logging.INFO)With the basicConfig method, the logging module can be modified to display other severity levels.
When navigating to http://localhost:5000/ the terminal output will now show the info log entry like this INFO:root:Info from the index function. With the basicConfig function, other properties can also be configured. For example, with
logging.basicConfig(
    level=logging.INFO,
    format="%(asctime)s - %(name)s - %(process)d - %(levelname)s - %(message)s",
)
the log entry looks like this 2024-02-07 07:34:50,096 - root - 19594 - INFO - Info from the index function with a timestamp, the module name, the process id, the severity level and the log message - separated by hyphens.
Besides simple logging messages, complex structures can also be printed in log entries. To demonstrate the capabilities of logging complex structures, navigate to the get_user function in app.py. In this function, a user will be fetched from an imaginary database. The user can be None and can be printed to the terminal, since a __str__ function in the User class is defined. To log a user, simply call any of the logging severity functions and pass an instantiated user.
@app.route("/users", methods=["GET"])
def get_user():
    user, status = db.get_user(123)
    logging.info(f"Found user {user!s} with status {status}")
In this example, a log entry with the severity level info will be printed to the terminal with the message and the user and status embedded. When navigating to http://localhost:5000/users the log entry will look like this:
2024-02-07 09:18:51,864 - root - 47799 - INFO - Found user id: 77, name: Aaron Mcbride, address: 177 Cooper Branch
Campbellchester, TX 16806 with status 200
Another use case could be to make a case differentiation when the user is None, with the severity level of warning to signal that no user was found with the ID. The function could look like this:
@app.route("/users", methods=["GET"])
def get_user():
    user, status = db.get_user(123)
    logging.info(f"Found user {user!s} with status {status}")
    data = {}
    if user is not None:
        data = {"id": user.id, "name": user.name, "address": user.address}
    else:
        logging.warning(f"Could not find user with id {123}")
    logging.debug(f"Collected data is {data}")
    response = make_response(data, status)
    logging.debug(f"Generated response {response}")
    return response
Let’s return to the topic of OpenTelemetry. As discussed in the previous chapter, OpenTelemetry integrates itself into existing logging modules via its Logging Bridge API - therefore the excursion into the Python logging module. There are two ways to enable OpenTelemetry logging in Python projects. One method is via automatic instrumentation, which is discussed later in this course. The other way is to set up logging manually.
To do so, add a new file to the src folder, called logging_utils.py. In this file the handler will be set up, that is used in the main app.py file. To set up the handler, the LoggerProvider, LoggingHandler, ConsoleLogExporter and SimpleLogRecordProcessor need to be imported. Then a LoggerProvider can be set up to take a Resource that is associated with the LogRecords. With the created LoggerProvider a LogRecordProcessor can be added with add_log_record_processor. In this example case, a simplistic SimpleLogRecordProcessor is used. This processor processes the logs as soon as they are created. Another method is to use a BatchLogRecordProcessor that collects multiple LogRecords and processes them in a batch. Into the Processor, a ConsoleLogExporter is passed that exports logs to the console. In the end, a LoggingHandler can be instantiated that uses the LoggerProvider.
from opentelemetry.sdk._logs import LoggerProvider, LoggingHandler
from opentelemetry.sdk._logs.export import ConsoleLogExporter, SimpleLogRecordProcessor
from opentelemetry.sdk.resources import Resource

logger_provider = LoggerProvider(
    resource=Resource.create(
        {
            "service.name": "example-app",
        }
    ),
)

logger_provider.add_log_record_processor(SimpleLogRecordProcessor(ConsoleLogExporter()))
handler = LoggingHandler(logger_provider=logger_provider)
This LoggingHandler then needs to be attached to the logging module of Python. This can be done in app.py with:
from logging_utils import handler

logger = logging.getLogger()
logger.addHandler(handler)
With this setup, all logs of the logging module are now exported as OpenTelemetry logs and look like this:
{
    "body": "Found user id: 711, name: Denise Schultz, address: 2188 Hall Street Suite 268\nSouth Joseph, VI 41735 with status 200",
    "severity_number": "<SeverityNumber.INFO: 9>",
    "severity_text": "INFO",
    "attributes": null,
    "dropped_attributes": 0,
    "timestamp": "2024-02-07T12:00:10.246927Z",
    "trace_id": "0x00000000000000000000000000000000",
    "span_id": "0x0000000000000000",
    "trace_flags": 0,
    "resource": "BoundedAttributes({'telemetry.sdk.language': 'python', 'telemetry.sdk.name': 'opentelemetry', 'telemetry.sdk.version': '1.22.0', 'service.name': 'example-app'}, maxlen=None)"
}
Since no tracing is set up, the trace_id and span_id are 0. There are many other exporters that OpenTelemetry can utilize. To showcase what logs look like, this is the simplest way. In the OpenTelemetry Python repository is a further example of how to set up manual instrumentation with an OpenTelemetry Collector exporter.
Resources
- https://opentelemetry.io/docs/concepts/signals/logs/
- https://opentelemetry.io/docs/specs/otel/logs/
- https://opentelemetry.io/docs/specs/otel/logs/data-model/
- https://opentelemetry.io/docs/languages/python/getting-started/
- https://github.com/open-telemetry/opentelemetry-python
- https://opentelemetry-python-contrib.readthedocs.io/en/latest/instrumentation/logging/logging.html