Traces
Introduction
Overview
Overview of OpenTelemetry’s tracing signal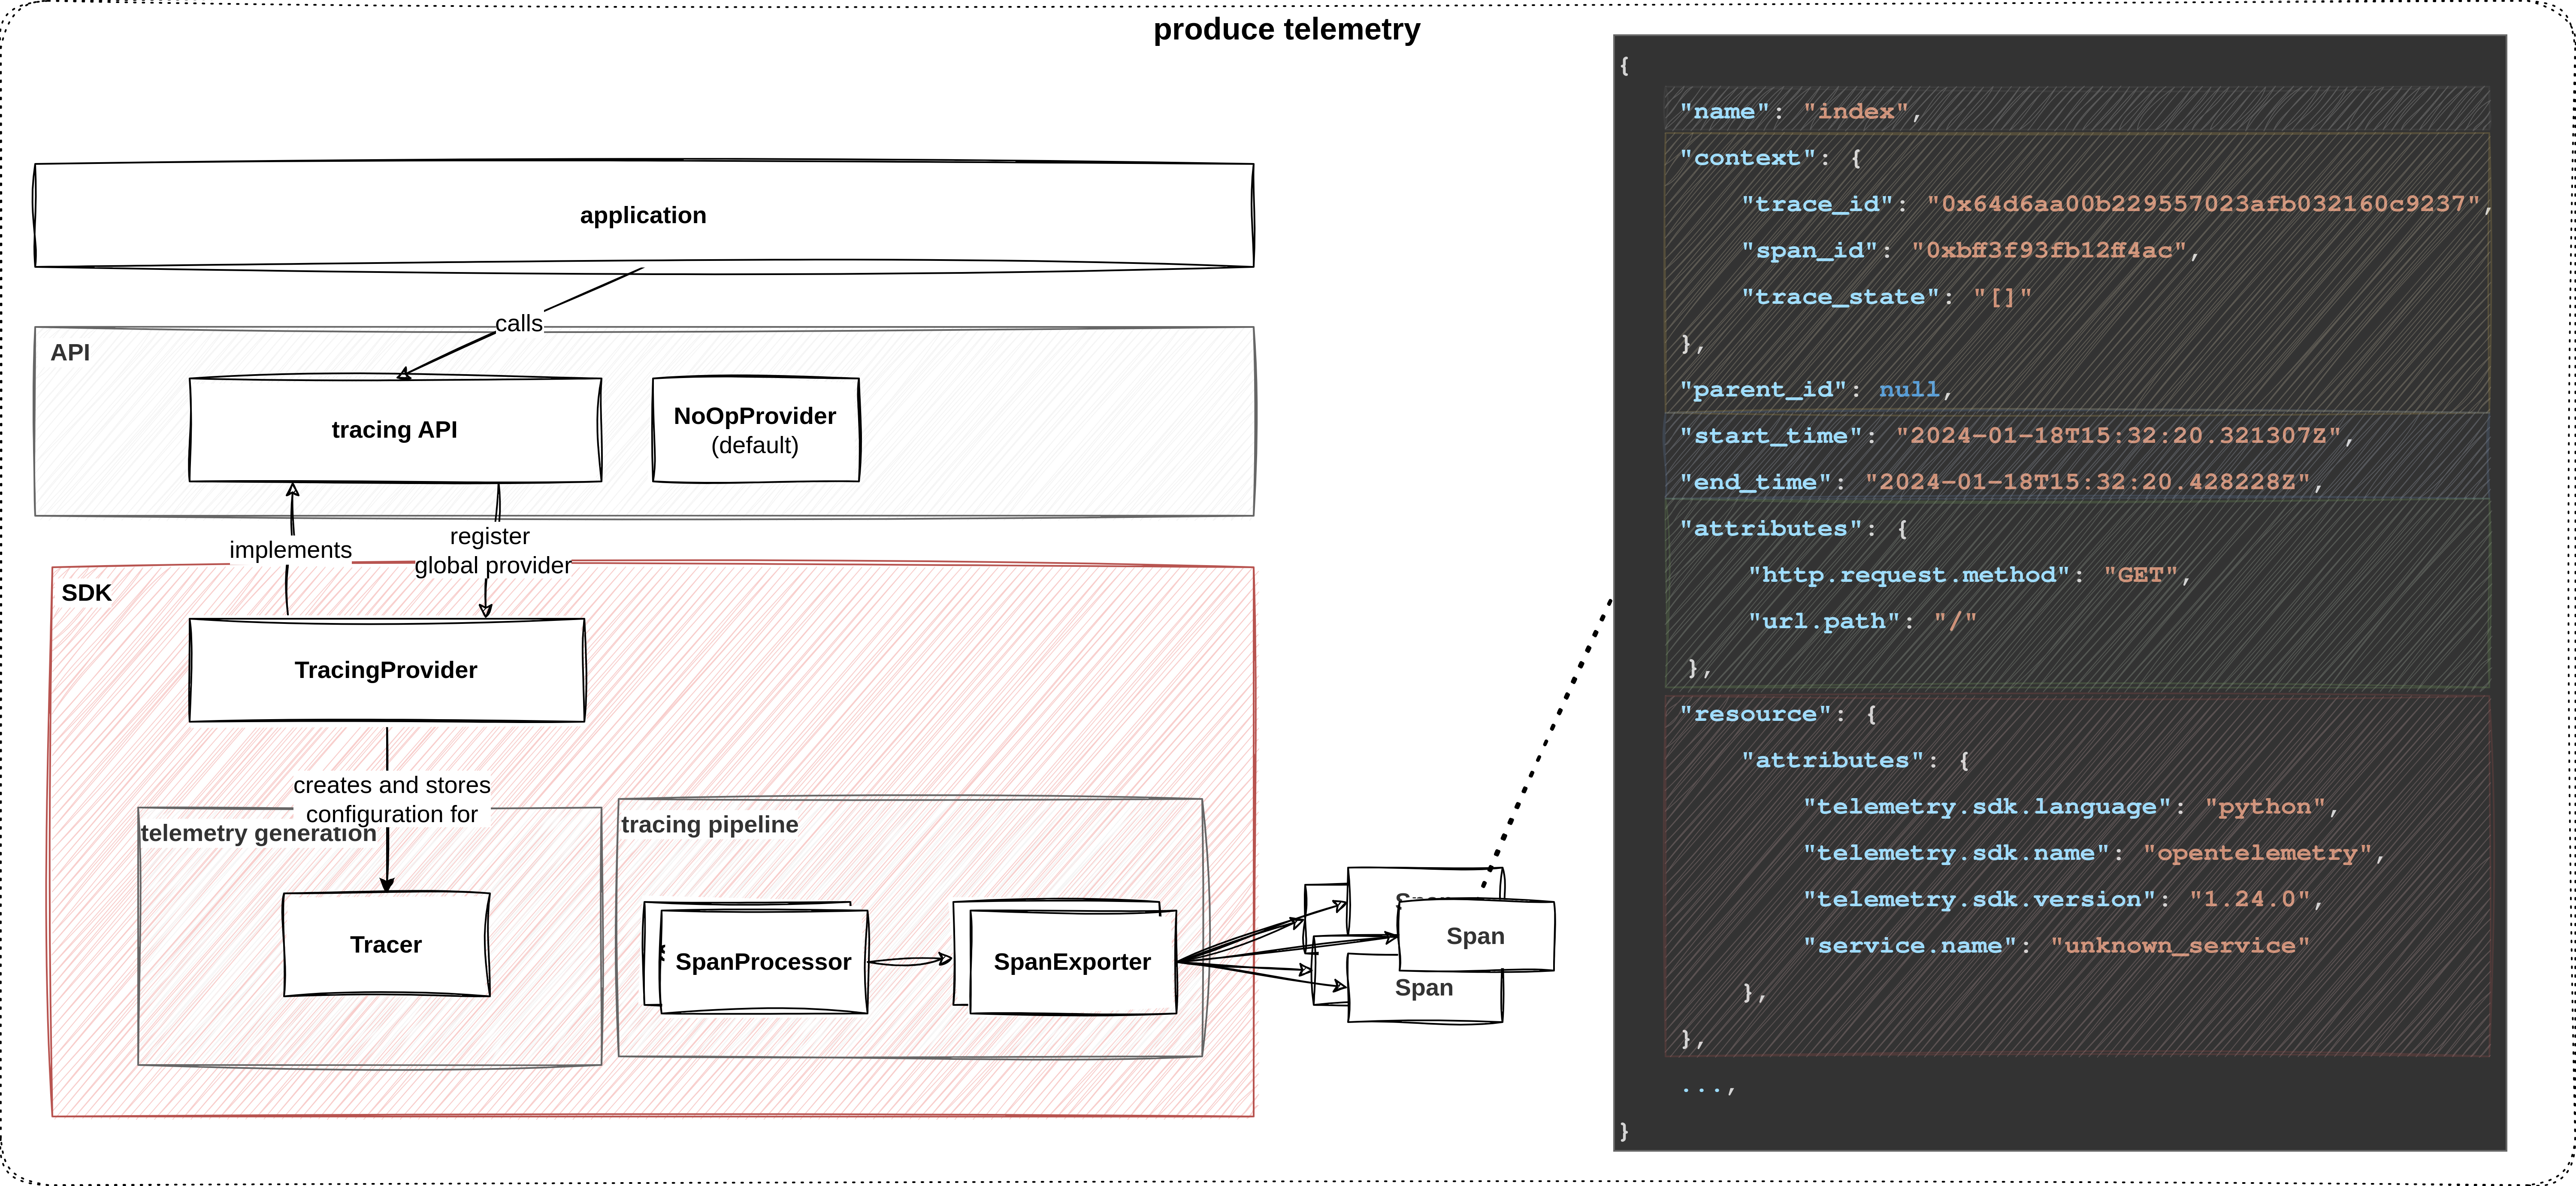
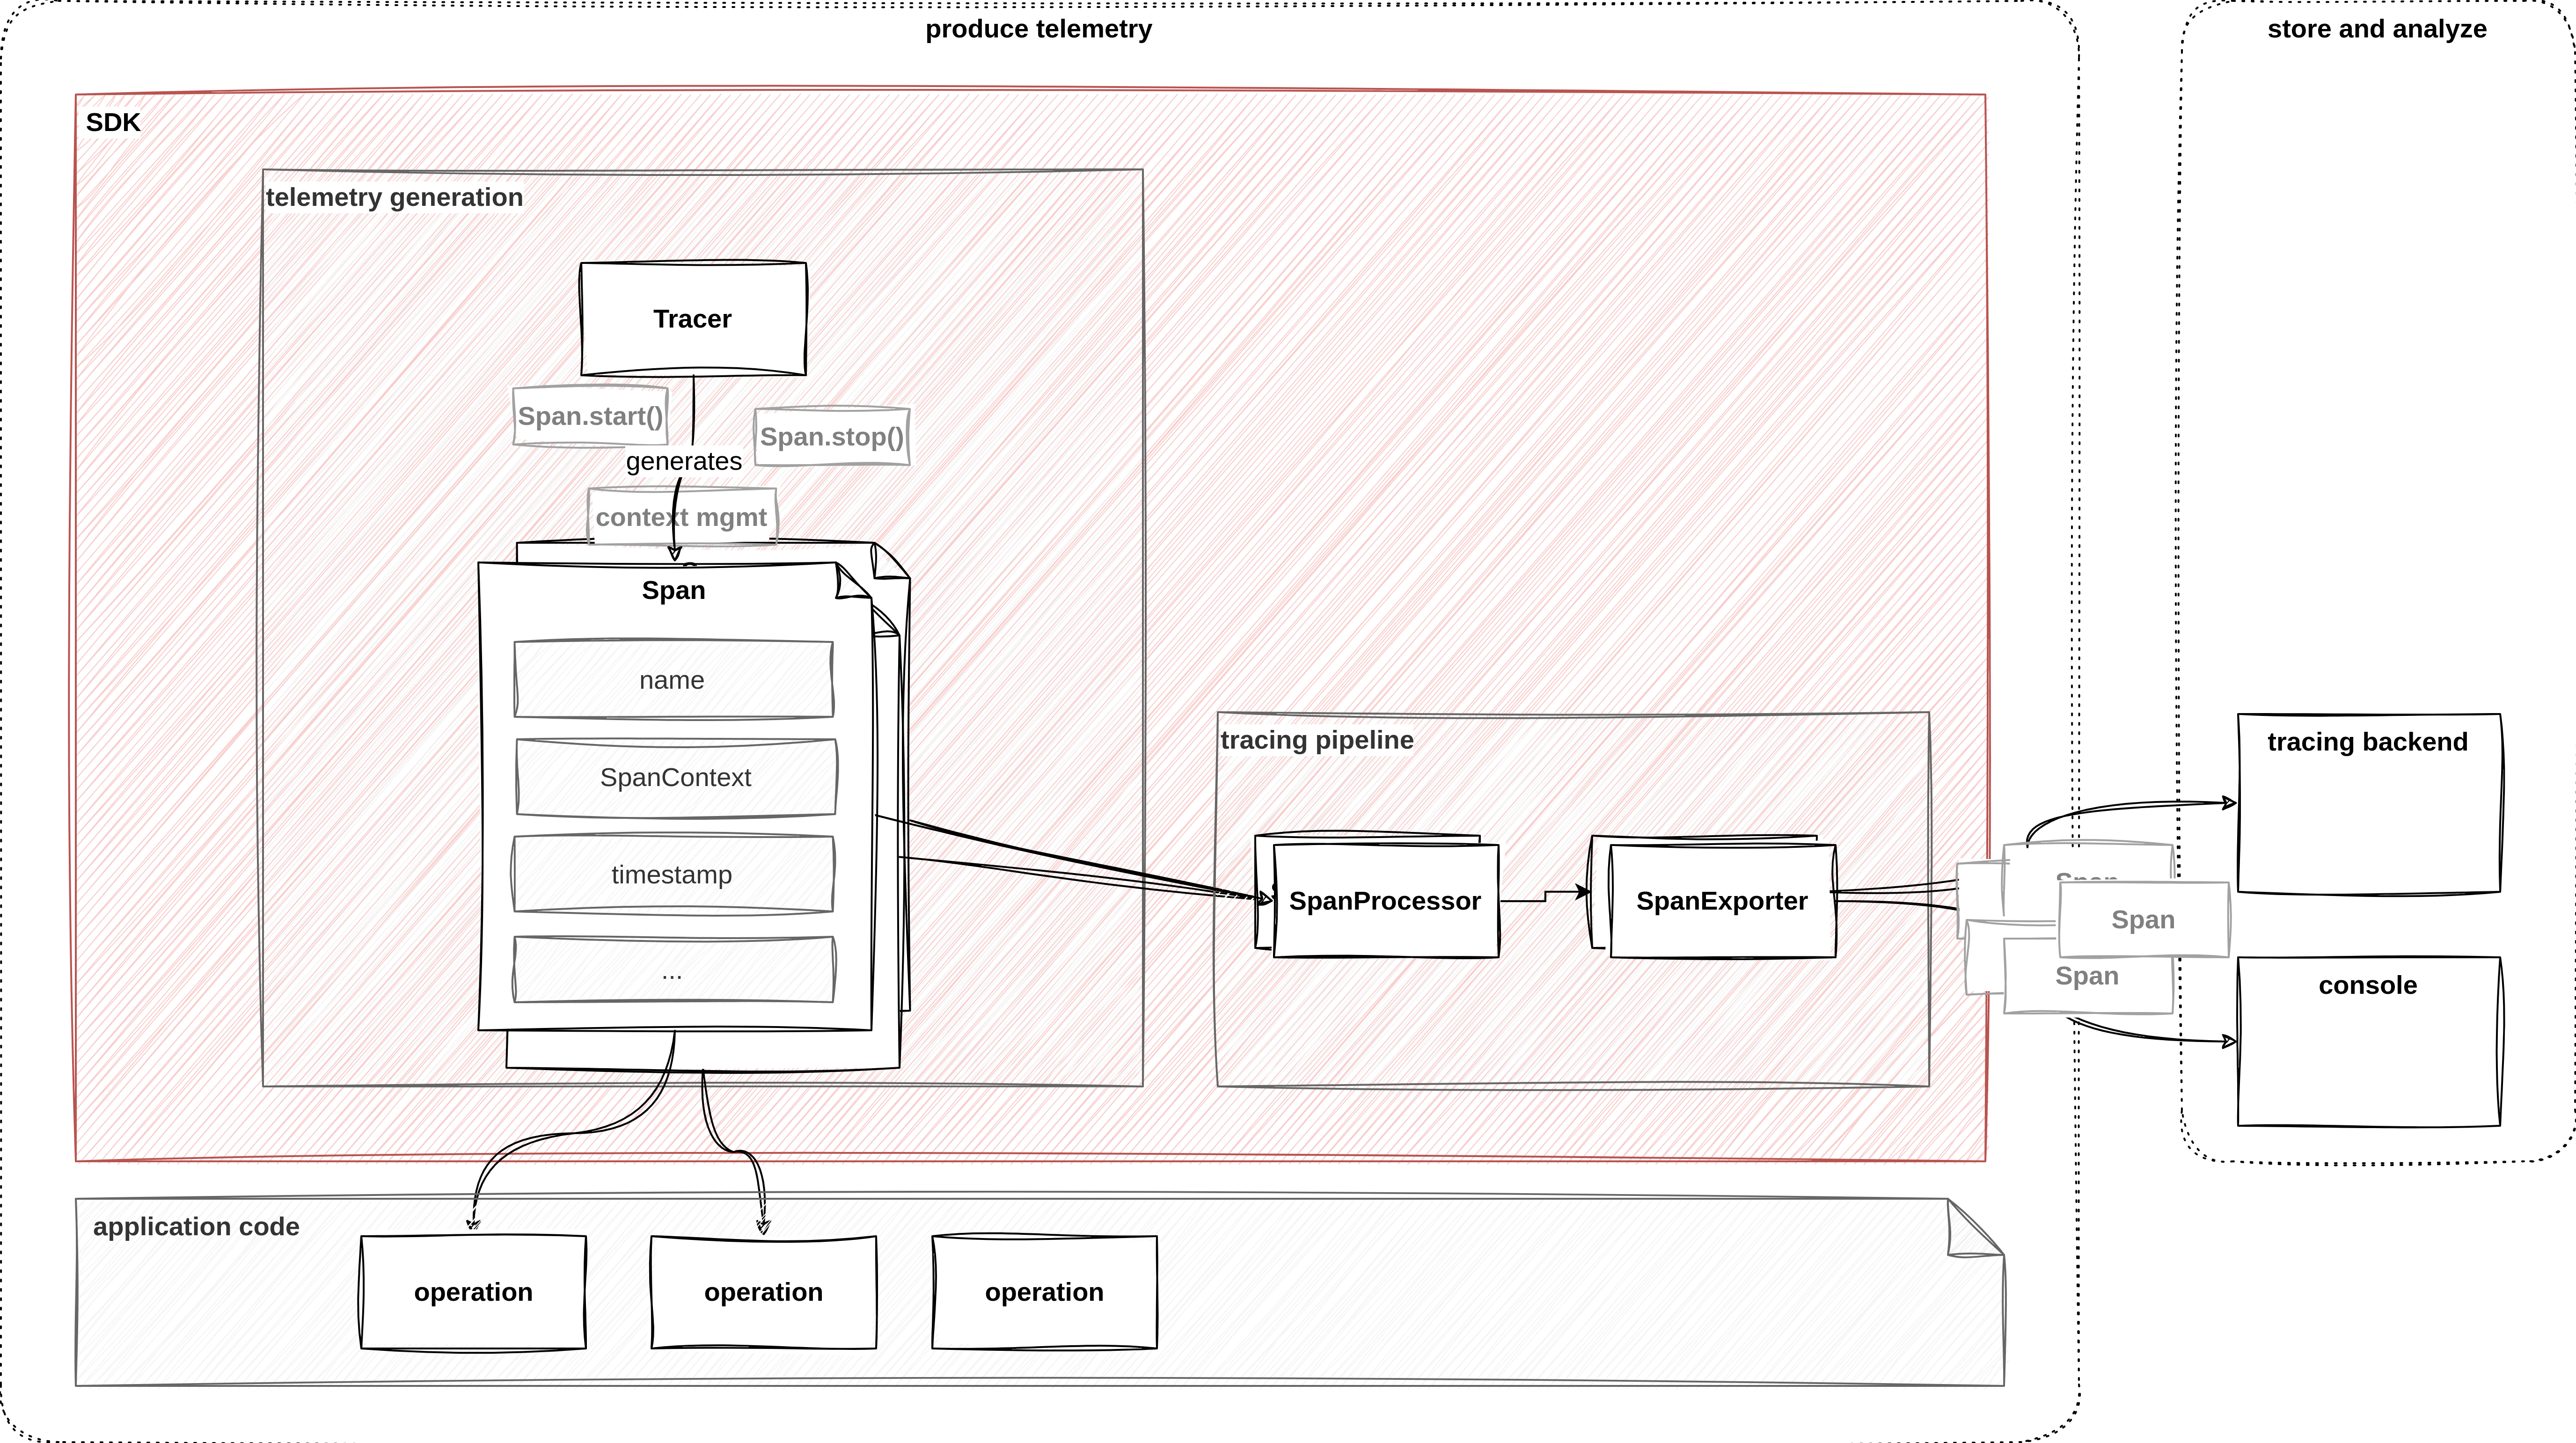
TracingProvider, which contains the logic that implements the tracing API.
We’ll use it to create a Tracer and configure a tracing pipeline (within the SDK).
The application uses the tracer to generate spans.
The tracing pipeline consists of one (or more) SpanProcessor and SpanExporters, which define how spans are processed and forwarded.
This lab exercise demonstrates how to add tracing instrumentation to a Python application. The purpose of the exercises is to learn about the anatomy of spans and OpenTelemetry’s tracing signal. It does not provide a realistic deployment scenario. In previous exercises, we exported spans to a tracing backend and analyzed traces via Jaeger. In this lab, we output spans to the local console to keep things simple.
Learning Objectives
By the end of this lab, you will be able to:
- use the OpenTelemetry API and configure the SDK to generate spans
- understand the basic structure of a span
- enrich spans with additional metadata
- ensure trace context propagation so spans can be connected into a trace
How to perform the exercises
- This exercise is based on the following repository repository
- All exercises are in the subdirectory
exercises. There is also an environment variable$EXERCISESpointing to this directory. All directories given are relative to this one. - Initial directory:
manual-instrumentation-traces/initial - Solution directory:
manual-instrumentation-traces/solution - Python source code:
manual-instrumentation-traces/initial/srcThe environment consists of two components:
- a Python service
- uses Flask web framework
- listens on port 5000 and serves serveral HTTP endpoints
- simulates an application we want to instrument
- echo server
- listens on port 6000, receives requests and sends them back to the client
- called by the Python application to simulate communication with a remote service
- allows us to inspect outbound requests
To work on this lab, open three terminals.
- Terminal to run the echo server
Navigate to
cd $EXERCISES
cd manual-instrumentation-traces/initial
Start the echo server using
docker compose up- Terminal to run the application and view it’s output
Change to the Python source directory
cd $EXERCISES
cd manual-instrumentation-traces/initial/src
Start the Python app/webserver
python app.py- Terminal to send request to the HTTP endpoints of the service
The directory doesn’t matter here
Test the Python app:
curl -XGET localhost:5000; echoYou should see a response of the following type:
Hello, World! It's currently Thu, 11 Jul 2024 09:49:38Test the echo server:
curl -XGET localhost:6000; echoYou should see a JSON response starting like:
{"host":{"hostname":"localhost","ip":"::ffff:172.20.0.1","ips":[]},"http":{"method":"GET","baseUrl"...}To keep things concise, code snippets only contain what’s relevant to that step.
If you get stuck, you can find the solution in the exercises/manual-instrumentation-traces/solution/src
Configure the tracing pipeline and obtain a tracer
Inside the src directory, create a new file trace_utils.py.
We’ll use it to separate tracing-related configuration from the main application app.py, which already exists.
At the top of the file, specify the imports and create a new function create_tracing_pipeline as displayed below:
# OTel SDK
from opentelemetry.sdk.trace.export import ConsoleSpanExporter, BatchSpanProcessor

def create_tracing_pipeline() -> BatchSpanProcessor:
    console_exporter = ConsoleSpanExporter()
    span_processor = BatchSpanProcessor(console_exporter)
    return span_processor
For debugging purposes, we’ll instantiate a ConsoleSpanExporter to write spans to the local console.
Next, we have to create a SpanProcessor that sits at the end of our pipeline. Its main responsibility is to push spans to one (or more) SpanExporter.
Here, we can choose between two categories:
- synchronous (i.e. SimpleSpanProcessor)
- blocks the program execution to forward spans as soon as they are generated
- real-time, but means that instrumentation increases latency of requests
- asynchronous (i.e. BatchSpanProcessor)
- application starts and closes spans, but immediately resumes execution
- completed spans are maintained in a buffer, a separate thread flushes batches of spans at regular intervals
- has performance advantages, but spans might be dropped (because the application crashes before spans are exported, spans exceed the buffer capacity)
We created a BatchSpanProcessor and pass the exporter to the constructor to connect both.
Let’s begin by importing OpenTelemetry’s tracing API and the TracerProvider from the SDK as shown below.
With a basic pipeline in place, let’s focus on instrumentation.
Import the tracing API and the TracerProvider as shown below.
Create a new function create_tracer and instantiate a TracerProvider with the help of the SDK package.
Next, call the add_span_processor method and connect it to the tracing pipeline.
By default, calls to the OpenTelemetry API are translated into noops.
To call the SDK instead, we must register our TracerProvider with the API via the set_tracer_provider function.
After that, we can finally call get_tracer on the provider to obtain a Tracer.
Pass the service name and version as parameters, to uniquely identify the instrumentation.
# OTel API
from opentelemetry import trace as trace_api

# OTel SDK
from opentelemetry.sdk.trace import TracerProvider

def create_tracer(name: str, version: str) -> trace_api.Tracer:
    # setup provider
    provider = TracerProvider()
    provider.add_span_processor(create_tracing_pipeline())

    # register SDK to replace noop implementation
    trace_api.set_tracer_provider(provider)
    tracer = trace_api.get_tracer(name, version)
    return tracer
In app.py import the create_tracer function and assign the return value to a global variable called tracer.
from trace_utils import create_tracer

# global variables
app = Flask(__name__)
tracer = create_tracer("app.py", "0.1")
Run the python command to verify that there are no errors.
python app.pyThe application uses the tracer to generate spans.
In app.py, import create_tracer, invoke it, and assign the return value to a global variable called tracer.
Generate spans
Tracing signal
With the help of a tracer, let’s generate our first piece of telemetry. On a high level, we must add instrumentation to our code that creates and finishes spans. OpenTelemetry’s Python implementation provides multiple ways to do this. Some aim to be simple and non-intrusive, while others are explicit but offer greater control. For brevity, we’ll stick to a decorator-based approach.
Add the start_as_current_span decorator to the index function.
Notice that this decorator is a convenience function that abstracts away the details of trace context management from us.
It handles the creation of a new span object, attaches it to the current context, and ends the span once the method returns.
@app.route("/", methods=["GET", "POST"])
@tracer.start_as_current_span("index")
def index():
    # ...
Switch to the terminal, where you ran python app.py before. If it is still running, leave it else start it again using
python app.pySwitch to your other terminal and use the following command to send a request to the / endpoint:
curl -XGET localhost:5000; echoThis causes the tracer to generate a span object, for which the tracing pipeline writes a JSON representation to the terminal. Take a look at the terminal where you application is running. You should see an output similar to the one shown below.
{
    "name": "index",
    "context": {
        "trace_id": "0x91762d8638140e0d1571815e67bdbcf4",
        "span_id": "0xfd427d3c11732ddd",
        "trace_state": "[]"
    },
    "kind": "SpanKind.INTERNAL",
    "parent_id": null,
    "start_time": "2024-07-11T12:00:23.481840Z",
    "end_time": "2024-07-11T12:00:23.598772Z",
    "status": {
        "status_code": "UNSET"
    },
    "attributes": {},
    "events": [],
    "links": [],
    "resource": {
        "attributes": {
            "telemetry.sdk.language": "python",
            "telemetry.sdk.name": "opentelemetry",
            "telemetry.sdk.version": "1.25.0",
            "service.name": "unknown_service"
        },
        "schema_url": ""
    }
}
A span in OpenTelemetry represents a single operation within a trace and carries a wealth of information that provides insight into the operation’s execution. This includes the name of the span, which is a human-readable string that describes the operation. The trace context, consisting of the trace_id, span_id, and trace_state, uniquely identifies the span within the trace and carries system-specific configuration data. The SpanKind indicates the role of the span, such as whether it’s an internal operation, a server-side operation, or a client-side operation. If the parent_id is null, it signifies that the span is the root of a new trace. The start_time and end_time timestamps mark the beginning and end of the span’s duration. Additionally, spans can contain attributes that provide further context, such as HTTP methods or response status codes, and a resource field that describes the service and environment. Other fields like events, links, and status offer additional details about the span’s lifecycle, outcome and context.
Enrich spans with context
enriching spans with resources and attributes
So far, the contents of the span were automatically generated by the SDK. This information is enough to reason about the chain of events in a transaction and allows us to measure latency. However, it’s important to understand that tracing is a much more potent tool. By enriching spans with additional context, traces can provide meaningful insights about what is happening in a system.
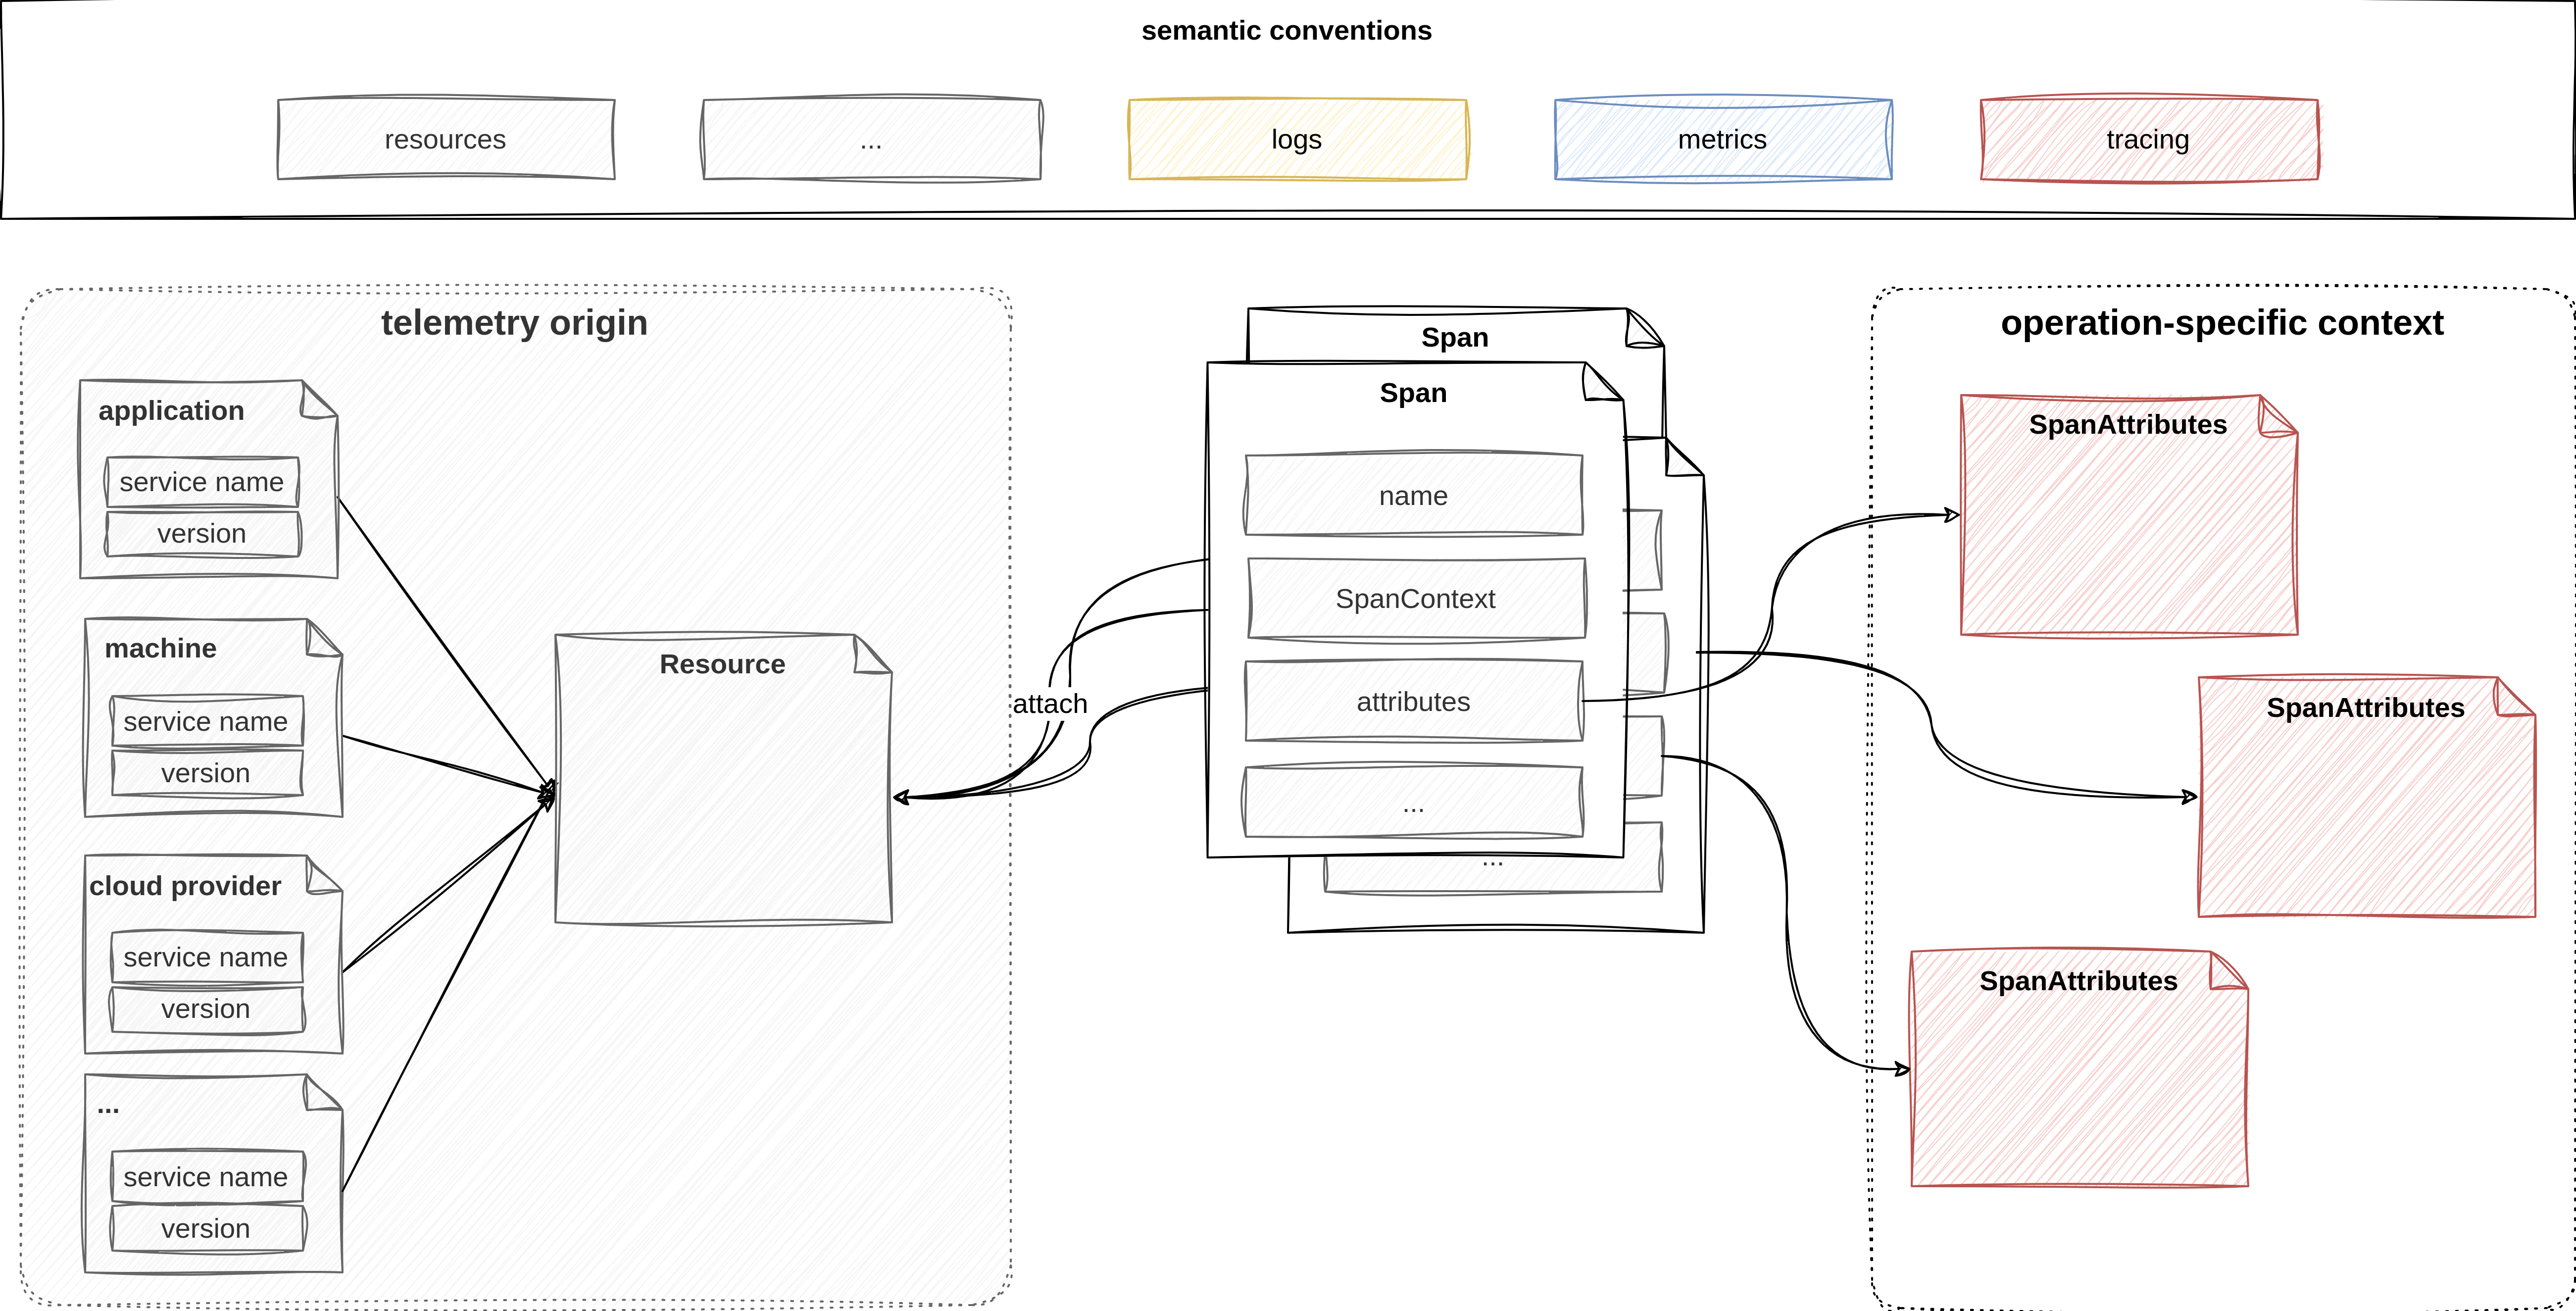
Resource
A Resource is a set of static attributes that help us identify the source (and location) that captured a piece of telemetry.
Right now, the span’s resource field only contains basic information about the SDK, as well as an unknown service.name.
Let’s look at how we can add additional properties.
Create a new file resource_utils.py in the src directory with the source code below:
from opentelemetry.sdk.resources import Resource

def create_resource(name: str, version: str) -> Resource:
    svc_resource = Resource.create(
        {
            "service.name": name,
            "service.version": version,
        }
    )
    return svc_resource
Edit the existing trace_utils.py as shown below to invoke functionality from resource_utils.
from resource_utils import create_resource

def create_tracer(name: str, version: str) -> trace_api.Tracer:
    # create provider
    provider = TracerProvider(
        resource=create_resource(name, version)
    )
    provider.add_span_processor(create_tracing_pipeline())
Specify the imports and create a function create_resource, which returns a Resource object.
By separating the resource and tracing configuration, we can easily reuse it with other telemetry signals.
Inside create_tracer, we pass the value returned by create_resource to the TraceProvider.
Let’s verify that everything works as expected. When editing the code live the automatic reload and restart might break. In this case you must restart the app again using.
python app.pySend a request using the previous curl command in the other terminal window.
curl -XGET localhost:5000; echoIf you look at the span exported to the terminal, you should now see that the resource attached to telemetry contains context about the service.
"resource": {
    "attributes": {
        "telemetry.sdk.language": "python",
        "telemetry.sdk.name": "opentelemetry",
        "telemetry.sdk.version": "1.24.0",
        "service.name": "app.py",
        "service.version": "0.1"
    },
    "schema_url": ""
}
This is just an example to illustrate how resources can be used to describe the environment an application is running in. Other resource attributes may include information to identify the physical host, virtual machine, container instance, operating system, deployment platform, cloud provider, and more.
Semantic conventions
There are only two hard things in Computer Science: cache invalidation and naming things. – Phil Karlton
Consistency is a hallmark of high-quality telemetry.
Looking at the previous example, nothing prevents a developer from using arbitrary keys for resource attributes (e.g. version instead of service.version).
While human intuition allows us to conclude that both refer to the same thing, machines are (luckily) not that smart.
Inconsistencies in the definition of telemetry make it harder to analyze the data down the line.
This is why OpenTelemetry’s specification includes semantic conventions.
This standardization effort helps to improve consistency, prevents us from making typos, and avoids ambiguity due to differences in spelling.
OpenTelemetry provides a Python package opentelemetry-semantic-conventions that was already installed as a dependency.
Let’s refactor our code.
Start by specifying imports at the top of the file and use ResourceAttributes within the create_resource function.
from opentelemetry.semconv.resource import ResourceAttributes

def create_resource(name: str, version: str) -> Resource:
    svc_resource = Resource.create(
        {
            ResourceAttributes.SERVICE_NAME: name,
            ResourceAttributes.SERVICE_VERSION: version,
        }
    )
    return svc_resource
Explore the documentation to look for a convention that matches the metadata we want to record.
The specification defines conventions for various aspects of a telemetry system (e.g. different telemetry signals, runtime environments, etc.).
Due to the challenges of standardization and OpenTelemetry’s strong commitment to long-term API stability, many conventions are still marked as experimental.
For now, we’ll use this as an example.
Instead of specifying the attributes keys (and sometimes values) by typing their string by hand, we reference objects provided by OpenTelemetry’s semconv package.
If you repeat the curl invocation and observe the trace you won’t see a difference there. Just the code is now cleaner as the attributes are being used from a standardized package instead of being hard-coded and hence prone to break when there are future changes.
SpanAttributes
Aside from static resources, spans can also carry dynamic context through SpanAttributes.
Thereby, we can attach information specific to the current operation to spans.
Modify app.py to match the following code snippet.
from flask import Flask, make_response, request

from opentelemetry import trace as trace_api
from opentelemetry.semconv.trace import SpanAttributes

@app.route("/", methods=["GET", "POST"])
@tracer.start_as_current_span("index")
def index():
    span = trace_api.get_current_span()
    span.set_attributes(
        {
            SpanAttributes.HTTP_REQUEST_METHOD: request.method,
            SpanAttributes.URL_PATH: request.path,
            SpanAttributes.HTTP_RESPONSE_STATUS_CODE: 200,
        }
    )
    do_stuff()
    ...
Make sure the application is still running after the changes. Otherwise restart it and redo the curl call.
curl -XGET localhost:5000; echoThe response will now contain span attributes.
"attributes": {
    "http.request.method": "GET",
    "url.path": "/",
    "http.response.status_code": 200
}
To illustrate this, let’s add the request method, path and response code to a span.
Call get_current_span to retrieve the active span.
Then, we can use set_attributes to pass a dictionary of key / value pairs.
The semantic conventions related to tracing standardize many attributes related to the HTTP protocol.
To access information like request method, headers, and more, we import request from the flask package.
Flask creates a request context for each incoming HTTP request and tears it down after the request is processed.
Context propagation
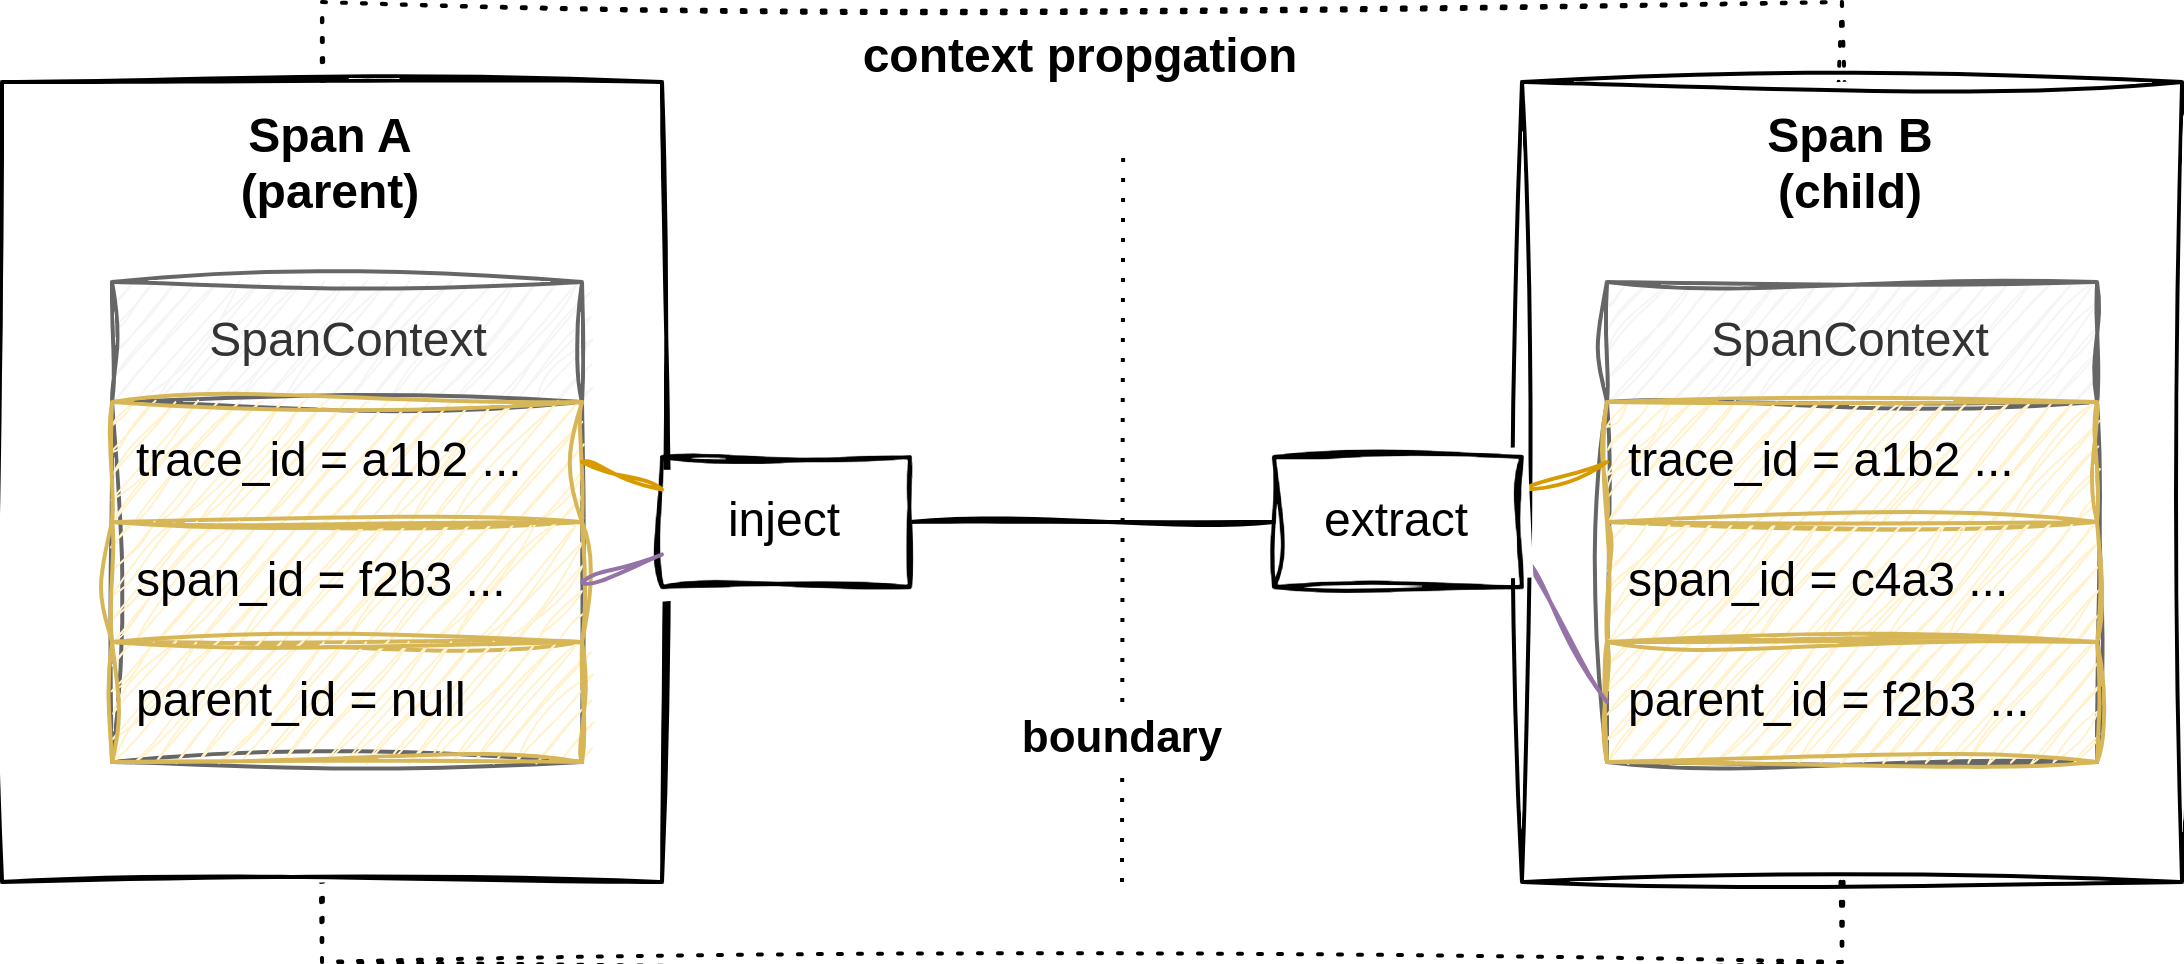
trace context propagation
Until now, we only looked at the contents of a singular span.
However, at its core, distributed tracing is about understanding the chain of operations that make up a transaction.
To construct a trace, we need to tie individual spans together.
To do that, we must pass contextual metadata between adjacent operations, which are separated by a logical boundary.
OpenTelemetry calls this information SpanContext.
The boundary could be in-process or a network.
As previously seen, the tracing SDK automatically generates a SpanContext for us.
Let’s investigate the current behavior of the application.
In app.py add a decorator to the do_stuff function to create a new span.
@tracer.start_as_current_span("do_stuff")
def do_stuff():
    # ...
Curl the / endpoint and look at the output.
{
    "name": "do_stuff",
    "context": {
        "trace_id": "0xbd57d76b8a29e9ff6ee1b016cf3a6d8b",
        "span_id": "0x7c6f99cad316bafe",
        "trace_state": "[]"
    },
    "parent_id": "0xed291d97f9c00a5a",
}
{
"name": "index",
"context": {
"trace_id": "0xbd57d76b8a29e9ff6ee1b016cf3a6d8b",
"span_id": "0xed291d97f9c00a5a",
"trace_state": "[]"
},
"parent_id": null,
}You should now see two span objects being generated.
If we compare the index and do_stuff span we see that:
- both share the same
trace_id. - the
parent_idof thedo_stuffspan matches thespan_idof theindexspan
In other words, do_stuff is a child span of index.
The tracing SDK automagically handles context propagation within the same process.
Let’s see what happens when there is a network boundary in between.
Inject trace context into outgoing requests
For testing purposes, the lab environment includes a echo server that returns the HTTP requests back to the client.
This is useful because it lets us examine what requests leaving our application look like.
do_stuff uses the requests package to send a get request to echo.
To examine what happens, let’s add some print statements to look at response.
Modify app.py according to the snippet below:
import json # <-- to pretty print response

@tracer.start_as_current_span("do_stuff")
def do_stuff():
    # ...
    response = requests.get(url)

    # debug
    print("Headers included in outbound request:")
    print(json.dumps(response.json()["request"]["headers"], indent=2))
    # ...
After restarting the webserver and using curl to send a request to the / endpoint, you should see the output from our print statements.
This will be printed out before the two spans
Headers included in outbound request:
{
  "host": "echo:6000",
  "user-agent": "python-requests/2.31.0",
  "accept-encoding": "gzip, deflate",
  "accept": "*/*",
  "connection": "keep-alive"
}
The request didn’t include any tracing headers!
If we do not inject SpanContext into outgoing requests, remote services have no information that the incoming request is part of an ongoing trace.
Therefore, the tracing instrumentation decides to start a new trace by generating a new, but disconnected, SpanContext.
The context propagation across services is currently broken.
OpenTelemetry’s data transmission system includes the concept of propagators.
Propagators serialize context, so it can traverse the network along with the request.
Let’s import the inject function from OpenTelemetry’s propagate API.
Create an empty dictionary and inject the headers from the current context into it.
All we have to do now is to include this context in outgoing requests.
The requests get method has a second argument that allows us to pass in information that will be sent as request headers.
Modify app.py again according to the snippet below:
from opentelemetry.propagate import inject

@tracer.start_as_current_span("do_stuff")
def do_stuff():
    headers = {}
    inject(headers)
    # ...
    response = requests.get(url, headers=headers) # <- inject trace context into headers
    # ...
Re-run our previous experiment with the echo server and look at the output of the print statement.
You should see that the outgoing request now contains a header called traceparent.
Headers included in outbound request:
{
  "traceparent": "00-69956358ff13fc2254725b20ad216aa9-4e3d02041cf8e504-01",
  # ...
}
If you have prior experience with distributed tracing, you might already know that different tracing systems use different formats (such as b3 propagation used by Zipkin).
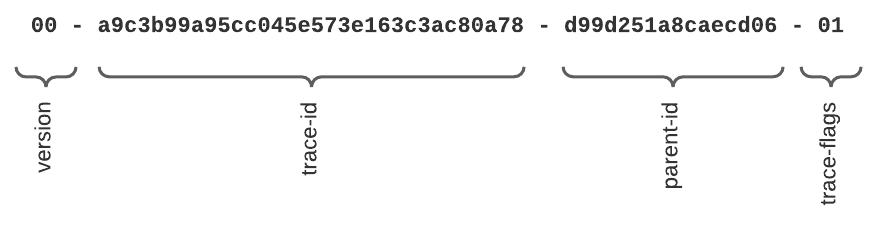
format used by the traceparent header Gud21
By default, OpenTelemetry uses a specification established by the World Wide Web Consortium (W3C).
Looking at the header’s value, we can infer that it encodes the trace context as <spec version>-<trace_id>-<parent_id>-<trace flag>.
Continue an existing trace
Let’s switch perspective.
Imagine that our Python application is a remote service that we send a request to.
In this scenario, the service must recognize that the incoming request is part of an ongoing trace.
To simulate this, let’s add the start_as_current_span decorator to the /users endpoint of the application.
@app.route("/users", methods=["GET"])
@tracer.start_as_current_span("users")
def get_user():
    # ...
Use the curl command shown to send a request with a fictional tracing header to the application.
curl -XGET "localhost:5000/users" --header "traceparent: 00-aaaaaaaaaaaaaaaaaaaaaaaaaaaaaaaa-00ffffffffffffff-01"If you look at the output, you will notice that the tracer generated a span with a random trace_id and no parent_id.
But this is not the behaviour what we want!
Recall that start_as_current_span instantiates spans based on the current context of the tracer.
Apparently, the local context doesn’t include information about the traceparent header in inbound requests.
Flask provides a special before_request decorator to execute a function before the normal request handler runs.
Create a function before_request_func.
We’ll use it to create a custom context, which subsequently gets picked up by start_as_current_span.
Import extract function from propagate.
Construct a new Context object by passing the request headers as an argument.
Call the attach function to set a new active context.
The function returns a string token that references the context before we call attach.
Store it on Flask’s request context, so we can retrieve it later.
Flask’s teardown_request request decorator allows us to register a callback function that gets executed at the end of each request.
We’ll use it to restore the previous context.
Retrieve the token from Flask’s request context and pass it as an argument to detach.
Add the import statements and the 2 functions to the code:
from opentelemetry import context
from opentelemetry.propagate import inject, extract

@app.teardown_request
def teardown_request_func(err):
    previous_ctx = request.environ.get("previous_ctx_token", None)
    if previous_ctx:
        context.detach(previous_ctx)

@app.before_request
def before_request_func():
    ctx = extract(request.headers)
    previous_ctx = context.attach(ctx)
    request.environ["previous_ctx_token"] = previous_ctx
Make sure the app is up and running. After that repeat curl call:
curl -XGET "localhost:5000/users" --header "traceparent: 00-aaaaaaaaaaaaaaaaaaaaaaaaaaaaaaaa-00ffffffffffffff-01"Take a look at the span generated by the application. Finally! The context propagation is working as expected!
{
    "name": "users",
    "context": {
        "trace_id": "0xaaaaaaaaaaaaaaaaaaaaaaaaaaaaaaaa",
        "span_id": "0x48a97a9fd5588724",
        "trace_state": "[]"
    },
    "parent_id": "0x00ffffffffffffff"
}
The service should recognize the tracing header of the incoming request and create spans related to the transaction. Let’s verify our work.
If we were to export spans to a tracing backend, it could analyze the SpanContext of the individual objects and piece together a distributed trace.