Logs
Introduction
How did we get here
Logs are one of the main pillars of observability and part of the MELT acronym (Logs, Metrics, Traces and Events)
and is therefore incredibly important to determine the behavior and health of a system. Logs have the longest
legacy among all the signals. For decades simple instructions were used to print debug output to files or stdout
like System.out.println("Hello, World!") in Java, print('Hello, World!') in Python or the
println!("Hello, World!") Macro in Rust. Thereby Logs can represent any data you want. It could be structured
data like JSON
{
  "app": "example-app",
  "level": "debug",
  "message": "started example-app in 453ms",
  "timestamp": 1706876665982232832
}
or it could be unstructured data like a string, that signals which function call your program just entered.
entered function example_functionWith the increase in complexity of computer programs, especially with the introduction of distributed systems, just printing any data to a file or stdout wasn’t going to cut it anymore. Also, printing every debug statement to a file could accumulate large amounts of data, which could decrease available disk space and, in the worst-case, use up all the available disk space, which leads to crashes in the system. Frameworks, like Log4j, emerged that assisted the developer in creating more structured logs with including logging levels (Trace, Debug, Info, Warn, Error, Fatal), that could roughly filter log data, or automatically add data to enrich the log entries with essential data, like timestamps or the name of the class that created an entry. A log entry like this can, for example, be found in Spring Boot applications running in Docker:
example-app | 2024-02-02 12:06:49.335 INFO 1 --- [main] w.s.c.ServletWebServerApplicationContext : Root WebApplicationContext: initialization completed in 837 msThis log entry adds metadata like the service name (Docker), a timestamp when the log entry was generated (Spring),
a log level - in this case INFO, a context where the log was generated and in the end the log message.
With the rise of distributed systems and microservices, collecting the log entries just on the machine where the services were running has turned out to be impractical. So there was the need for log aggregation tools like fluentd, the ELK stack (Elasticsearch, Logstash, Kibana) or Grafana Loki. These tools can aggregate log entries from multiple sources to store these entries in a centralized solution. In the example, there are multiple containers deployed that run a log collector agent that sends log entries to a Grafana Loki instance. Loki stores the entries, indexes them and makes them queryable via LogQL. With LogQL logs, entries can then be explored with Grafana, where dashboards or alerts can be configured for the entries.
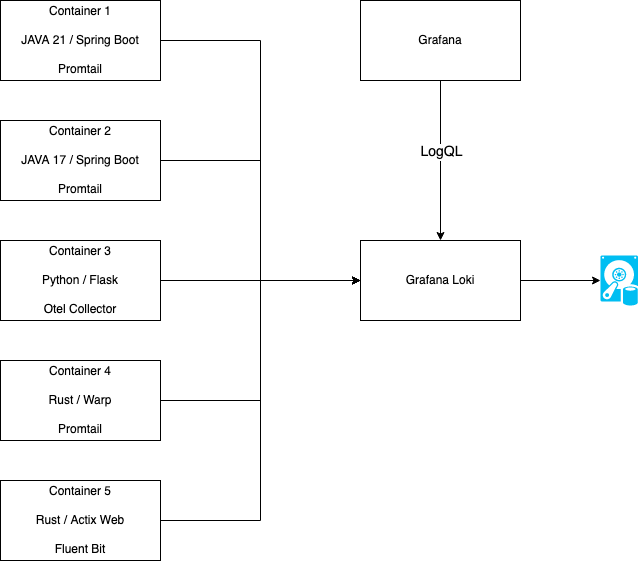
log aggregation
This enabled developers to perform indexing and searching to find failures and problems faster, run log analysis to find patterns or trends, monitor log entries to find anomalies or even trigger alerts or generate reports. This was a giant leap forward with using log entries in observability, but it still wasn’t perfect. If you tried to get more context like the call stack or other services, developers still needed to find the corresponding traces and spans by correlating the timestamp or IDs. Besides that, there are multiple formats for logs and multiple aggregators to collect the entries. Nothing is unified, and not every aggregator can read every logging format. This would lead to fragmentation and additional effort to integrate logging into the observability stack of an application.
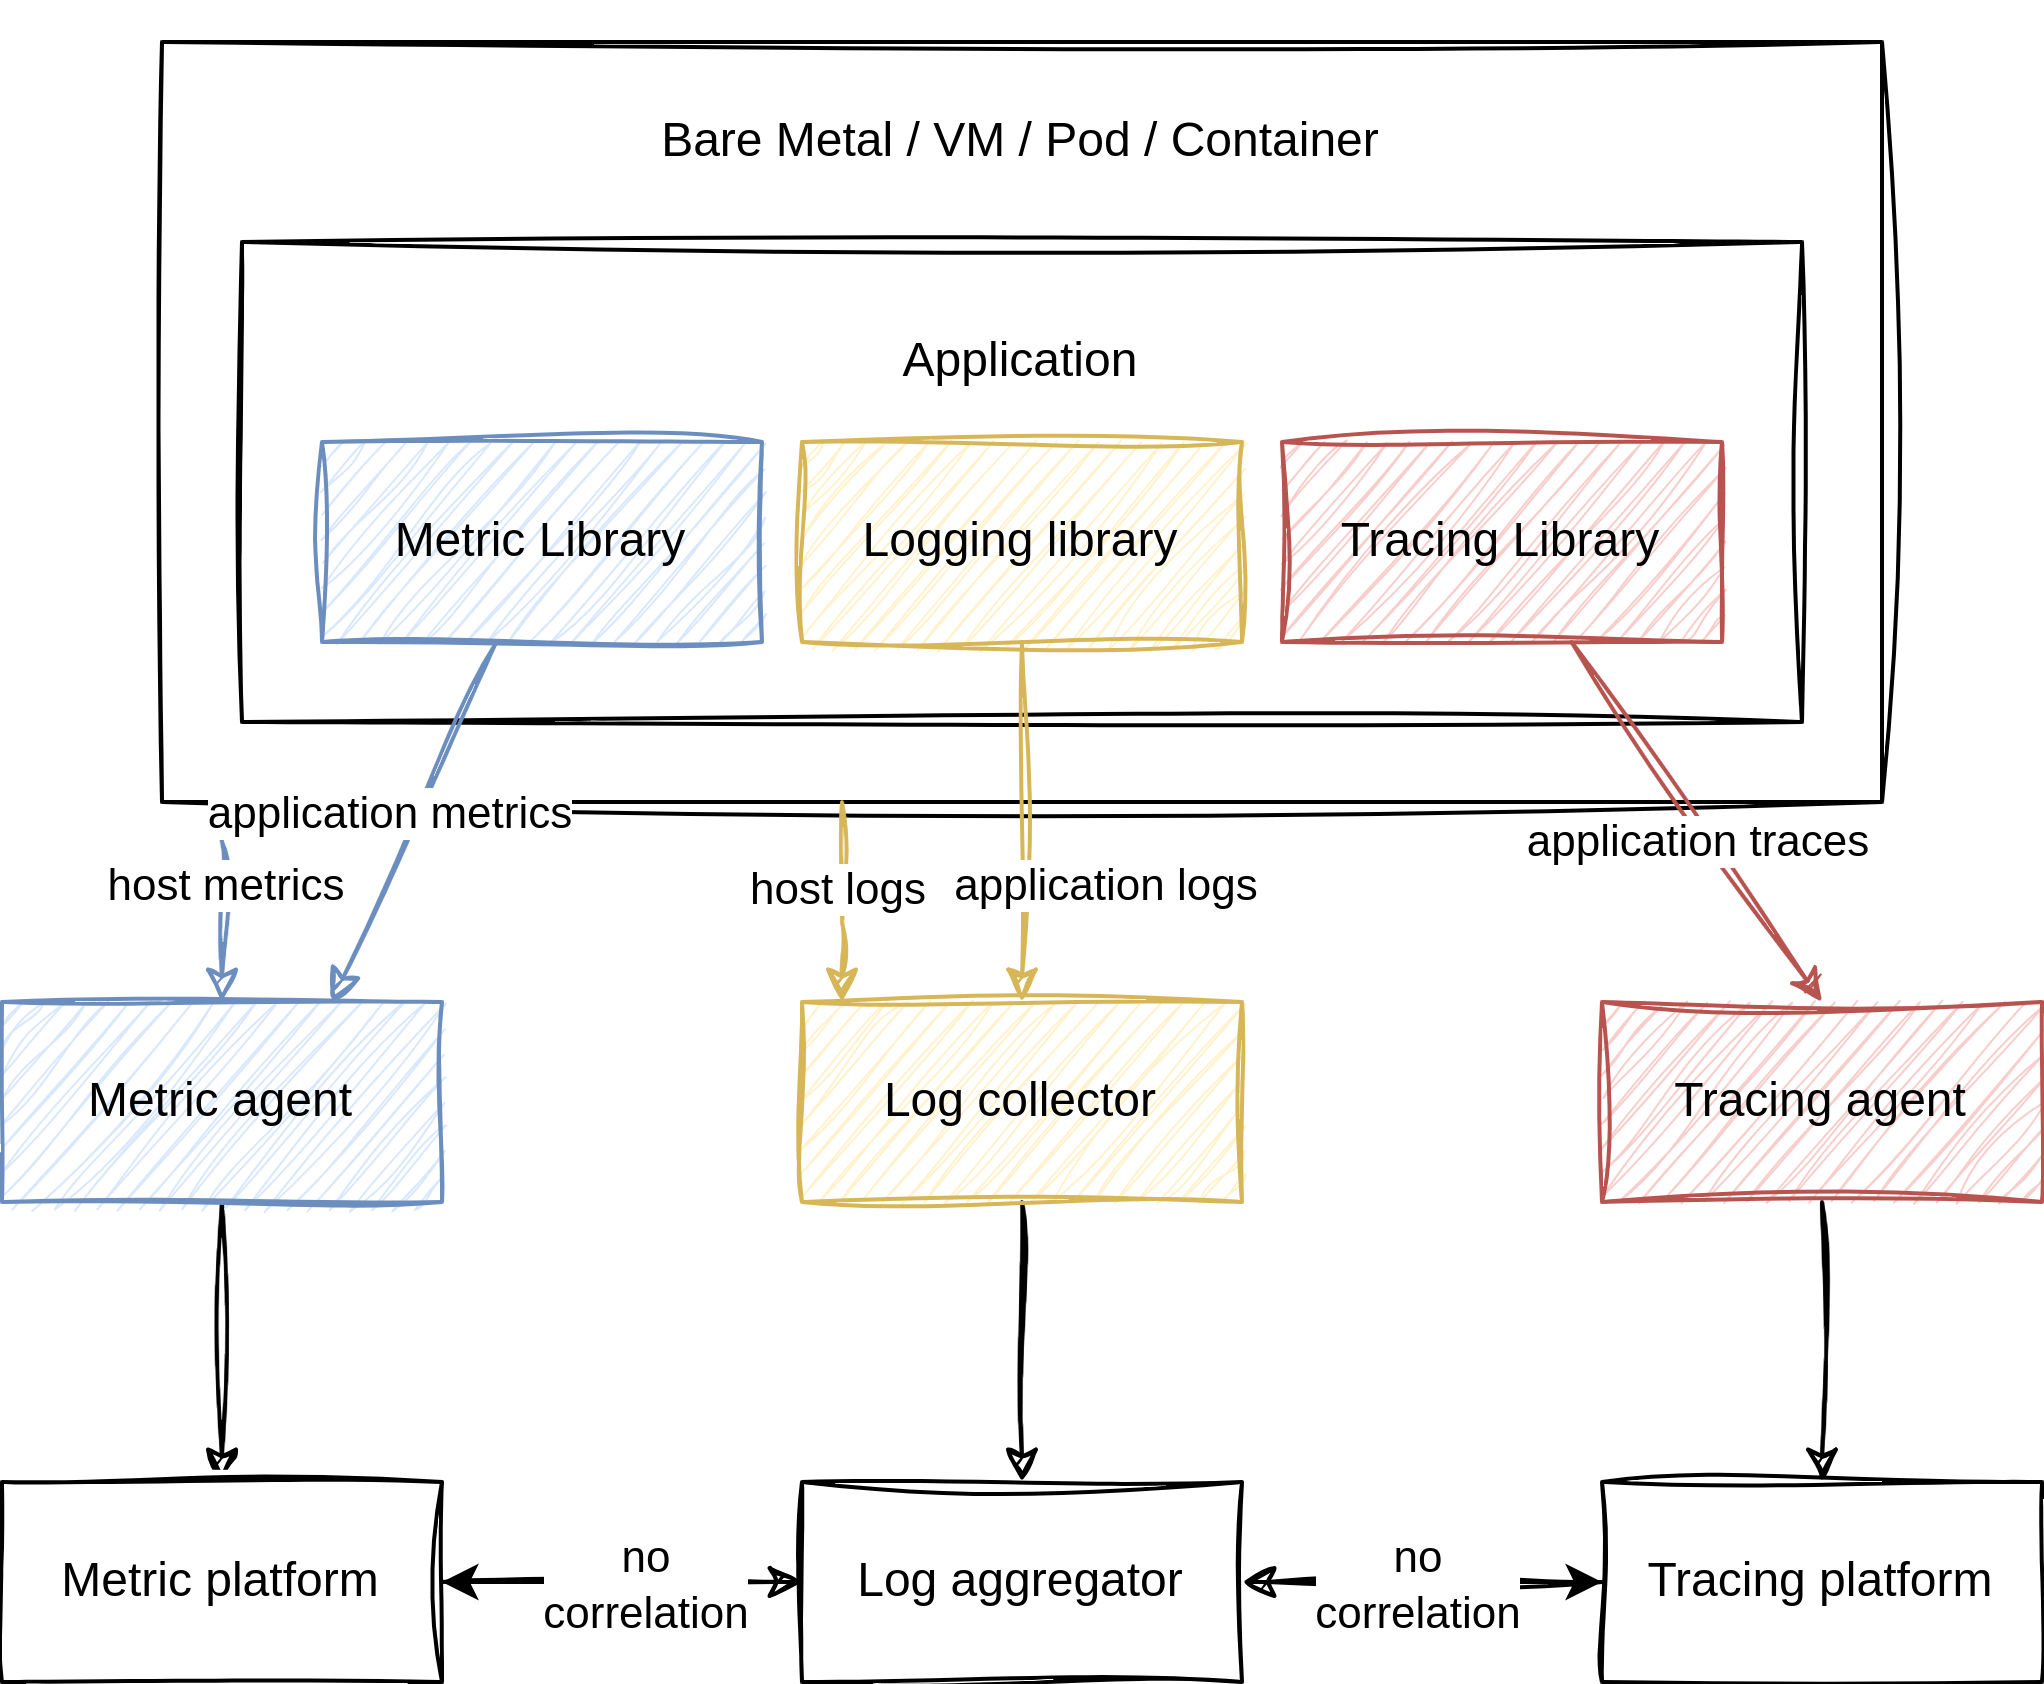
before OpenTelemetry
This is where the idea of OpenTelemetry Logging was born.
OpenTelemetry Logging
In OpenTelemetry every data that is neither a part of a distributed trace nor a metric
is considered a log. For example, events are just specialized log entries.
Logging in OpenTelemetry differs a little from the other signals. Logging is not
implemented from the ground up like traces and metrics, which are exposed in newly built
APIs and are implemented in SDKs. It uses existing logging functionality from programming
languages or existing logging libraries to integrate into. To accomplish that,
OpenTelemetry exposes a Logs Bridge API that combines the existing logging solution
with traces and metrics collected by OpenTelemetry or other components of OpenTelemetry.
This API should not be used by application developers, as it should be provided by the
logging solution. The logging solution should be configured to send log entries, also called
LogRecord, into a LogRecordExporter. The logging solution can use the LoggerProvider
factory to create new Logger instances that are initialized once and match the lifecycle
of the application. The created logger is responsible for creating log entries. When logs
are created, it’s the LogRecordExporters responsibility to send the log entries to a
collector like the OpenTelemetry Collector. The log entry, which is of type LogRecord,
consists of multiple fields like timestamp, traceId, spanId, severityText, body
and some more, that will be discussed in the hands-on chapter.
The data model of OpenTelemetry logging is designed in such a way that existing data models can be mapped to the OpenTelemetry data model. Translating logging data from an arbitrary logging format into the data model and then translating it into another logging format should not be worse than translating the initial logging format directly to the other format. The data model aims to represent multiple types of logs, like system formats that are generated by the operating system like syslog, third-party applications like logs that generate Apache log files and first-party applications where developers can modify the logging format. OpenTelemetry defines in the specs which fields map to which type, and for some logging formats and libraries mappings are already defined. With the OpenTelemetry stack, a unified way to collect telemetry data is created. Since logs provide additional metadata, all the collected telemetry data can be correlated to each other. In the following chapter, this will be further demonstrated.
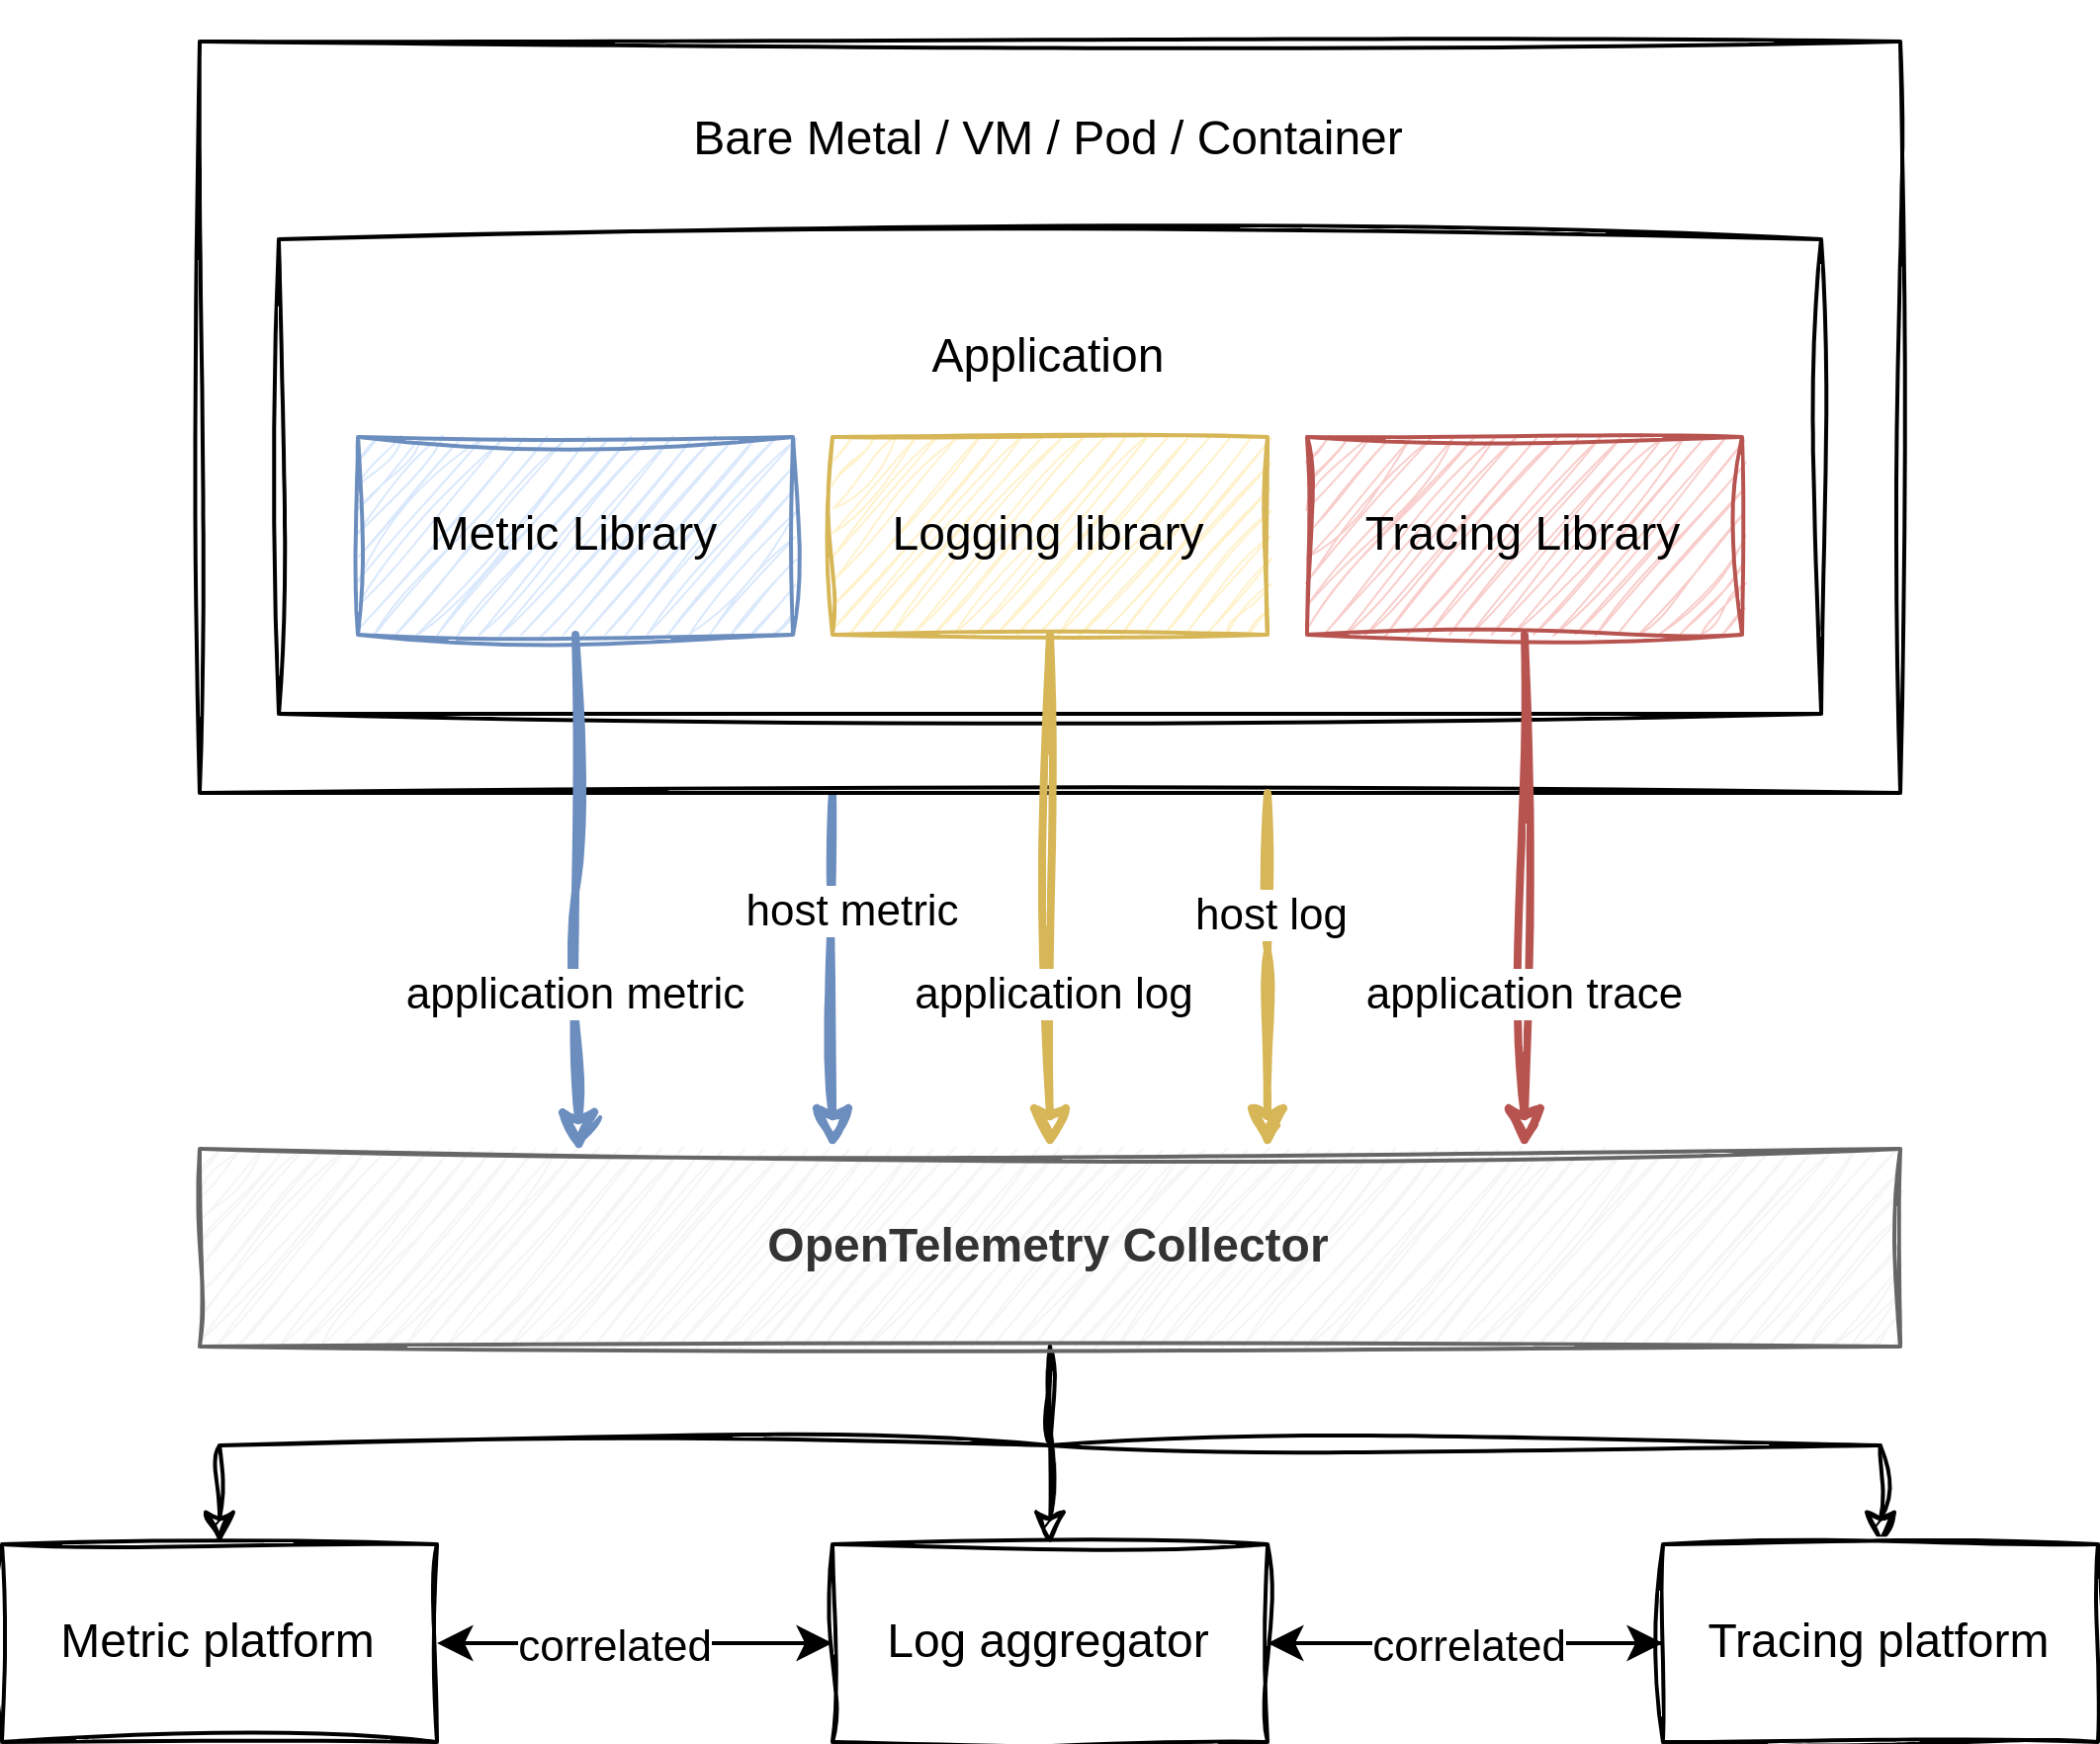
with OpenTelemetry
Learning Objectives
By the end of this lab, you will be able to:
- Apply manual instrumentation for logging to a Java application
- Use the OpenTelemetry API to build log records by yourself
- Understand the log record data model
- Use OpenTelemetryAppender libraries to append existing logging frameworks
How to perform the exercises
- This exercise is based on the following repository repository
- All exercises are in the subdirectory
exercises. There is also an environment variable$EXERCISESpointing to this directory. All directories given are relative to this one. - Initial directory:
manual-instrumentation-logs-java/initial - Solution directory:
manual-instrumentation-logs-java/solution - Java/Spring Boot backend component:
manual-instrumentation-logs-java/initial/todobackend-springboot
The environment consists of one component:
- Spring Boot REST API service
- uses Spring Boot framework
- listens on port 8080 and serves several CRUD style HTTP endpoints
- simulates an application we want to instrument
To start with this lab, open two terminals.
- Terminal to run the echo server
Navigate to
cd $EXERCISES
cd manual-instrumentation-logs-java/initial/todobackend-springboot
Run:
mvn spring-boot:run - Terminal to send request to the HTTP endpoints of the service
The directory doesn’t matter here
Test the Java app:
curl -XGET localhost:8080/todos/; echoYou should see a response of the following type:
[]To keep things concise, code snippets only contain what’s relevant to that step.
If you get stuck, you can find the solution in the exercises/manual-instrumentation-logs-java/solution
Logs Bridge
The demo-app is already using the Logback framework for logging. To create a LogsBridge, we first need to
configure OpenTelemetry properly. This time the OpenTelemetry dependencies are already included in the pom.xml.
For demonstration purposes, there is already a OpenTelemetryConfiguration.java file, which initializes
the tracing SDK. Hence, you only need to set up the logging SDK. We will export every LogRecord to the console.
Extend this configuration with an LoggerProvider like this:
        // set up LoggerProvider
        SdkLoggerProvider sdkLoggerProvider = SdkLoggerProvider.builder()
                .addLogRecordProcessor(
                        SimpleLogRecordProcessor.create(SystemOutLogRecordExporter.create())
                )
                .setResource(resource)
                .build();

        OpenTelemetry openTelemetry = OpenTelemetrySdk.builder()
                .setTracerProvider(sdkTracerProvider)
                .setLoggerProvider(sdkLoggerProvider) // <-- include LoggerProvider
                .build();

        return openTelemetry;
After that, you may edit the application itself and create a new global variable for the OpenTelemetry Logger.
Since there is already another Logger class from the package org.slf4j imported, we need to specify the
fully qualified name for the OpenTelemetry Logger.
private io.opentelemetry.api.logs.Logger otelLogger;This variable will be initialized within the constructor, as shown below:
        @Autowired
        public TodobackendApplication(OpenTelemetry openTelemetry) {

          this.tracer = openTelemetry.getTracer(TodobackendApplication.class.getName(), "0.1.0");
          this.otelLogger = openTelemetry.getLogsBridge()
                  .loggerBuilder(TodobackendApplication.class.getName())
                  .build();
        }
We want to create LogRecords for the method getTodos. The OpenTelemetry Logger allows us to build such records
and to set various properties, like the severity, attributes or the body.
Create a LogRecord within the method as shown below:
        @GetMapping("/todos/")
        List<String> getTodos() {

          // ...
          try (Scope scope = span.makeCurrent()) {
              todoRepository.findAll().forEach(todo -> todos.add(todo.getTodo()));
              logger.info("GET /todos/ " + todos.toString());

              // create log record
              otelLogger.logRecordBuilder()
                    .setAttribute(stringKey("http.request.method"), "GET")
                    .setTimestamp(Instant.now())
                    .setSeverity(Severity.INFO)
                    .setBody("GET /todos/")
                    .emit();
          }
          // ...
Start the app by running in the terminal:
mvn spring-boot:run After the app has started, send some request in your second terminal to call the getTodos method:
curl -XGET localhost:8080/todos/; echoAfter sending a request, you should see an output like this:
1: 09:25:34.346 [http-nio-8080-exec-1] INFO  i.n.t.TodobackendApplication - GET /todos/ []
2: 2024-07-21T09:25:34.346Z INFO 'GET /todos/' : dfd9f9db58f468fa274f48462b994098 f32233cb857d7177 [scopeInfo: io.novatec.todobackend.TodobackendApplication:] {http.request.method="GET"}
3: 09:25:34.346 [http-nio-8080-exec-1] INFO  i.o.e.logging.LoggingSpanExporter - 'getTodos' : dfd9f9db58f468fa274f48462b994098 f32233cb857d7177 INTERNAL [tracer: io.novatec.todobackend.TodobackendApplication:0.1.0] {}
The first line results from the ordinary logging of the application via Logback.
The second line results from the emitted LogRecord. The output includes the timestamp followed by
the severity and the actual log message. Additionally, the LogRecord contains data from OpenTelemetry, like the
current trace ID as well as span ID. That’s why we have also set up the tracing SDK. If the current context does not
contain any span while emitting the LogRecord, it will just show some zeros, indicating there is no current span.
At the end, the output contains the scope of the OpenTelemetry Logger as well as the set attributes.
The last line results from the SpanExporter of the tracing SDK and does not bother us right now.
Don’t replace the existing log API
The documentation of the LogsBridge itself, tells you:
The OpenTelemetry logs bridge API exists to enable bridging logs from other log frameworks (e. g. SLF4J, Log4j, JUL, Logback, etc) into OpenTelemetry and is NOT a replacement log API.
Even though it is tempting, you should not remove the existing logging solution from your application,
but extend it with the OpenTelemetry LogsBridge. Normally, this should not be done by the application developers themselves.
For instance, the OpenTelemetry Java agent uses bytecode injection to instrument logging frameworks.
Everytime the log method of a framework will be called, a LogRecord will also be emitted.
Log appender
When relying on manual instrumentation, you can also utilize libraries, which will append the OpenTelemetry Logger
to the existing logging solution.
Such libraries are the opentelemetry-logback-appender or opentelemetry-log4j-appender.
Since the demo application uses Logback, we will have to include the following dependency to the application:
        <dependency>
          <groupId>io.opentelemetry.instrumentation</groupId>
          <artifactId>opentelemetry-logback-appender-1.0</artifactId>
          <version>1.33.5-alpha</version>
        </dependency>
Additionally, you have to extend the existing Logback configuration to include the OpenTelemetry appender.
The Logback configuration file is located in the /resources directory of the project.
The path is manual-instrumentation-java-logs/initial/todobackend-springboot/src/main/resources/logback.xml.
Add two lines to the configuration like this:
        <?xml version="1.0" encoding="UTF-8"?>
        <configuration>

          <appender name="console" class="ch.qos.logback.core.ConsoleAppender">
            <encoder>
              <pattern>
                %d{HH:mm:ss.SSS} [%thread] %-5level %logger{36} - %msg%n
              </pattern>
            </encoder>
          </appender>

          <!-- Add this appender -->
          <appender name="otel" class="io.opentelemetry.instrumentation.logback.appender.v1_0.OpenTelemetryAppender"/>

          <root level="INFO">
            <appender-ref ref="console"/>
            <appender-ref ref="otel"/> <!-- Add this appender-ref -->
          </root>

        </configuration>
Then you can import the appender class in the application:
import io.opentelemetry.instrumentation.logback.appender.v1_0.OpenTelemetryAppender;Finally, you just have to install the appender with the created OpenTelemetry configuration.
That’s it. The appender is ready to use.
(Actually, you can also remove the otelLogger from the constructor and the getTodos method)
        @Autowired
        public TodobackendApplication(OpenTelemetry openTelemetry) {

          this.tracer = openTelemetry.getTracer(TodobackendApplication.class.getName(), "0.1.0");
          this.otelLogger = openTelemetry.getLogsBridge().loggerBuilder(TodobackendApplication.class.getName()).build();
          OpenTelemetryAppender.install(openTelemetry); // <-- install appender
        }
Restart the application and send some requests via:
curl -XGET localhost:8080/todos/; echoYou should see an output like below. First, the message from Logback. Second, the OpenTelemetry LogRecord.
You may notice, the appender creates records not just for the called method, but for the other application logs as well.
  10:37:25.041 [http-nio-8080-exec-1] INFO  i.n.t.TodobackendApplication - GET /todos/ []
  2024-07-216T10:37:25.041Z INFO 'GET /todos/ []' : 0354295cc77fa8d7b5ac81b528fa91ec 3fb721d75850fbde [scopeInfo: io.novatec.todobackend.TodobackendApplication:] {}
Resources
- https://opentelemetry.io/docs/concepts/signals/logs/
- https://opentelemetry.io/docs/specs/otel/logs/
- https://opentelemetry.io/docs/specs/otel/logs/data-model/
- https://opentelemetry.io/docs/languages/java/getting-started/
- https://opentelemetry.io/docs/languages/java/sdk/#sdkloggerprovider
- https://github.com/open-telemetry/opentelemetry-java