Metrics
Introduction
Overview
metric signal
Before diving head first into the lab exercises, let’s start with a brief overview of OpenTelemetry’s metrics signal.
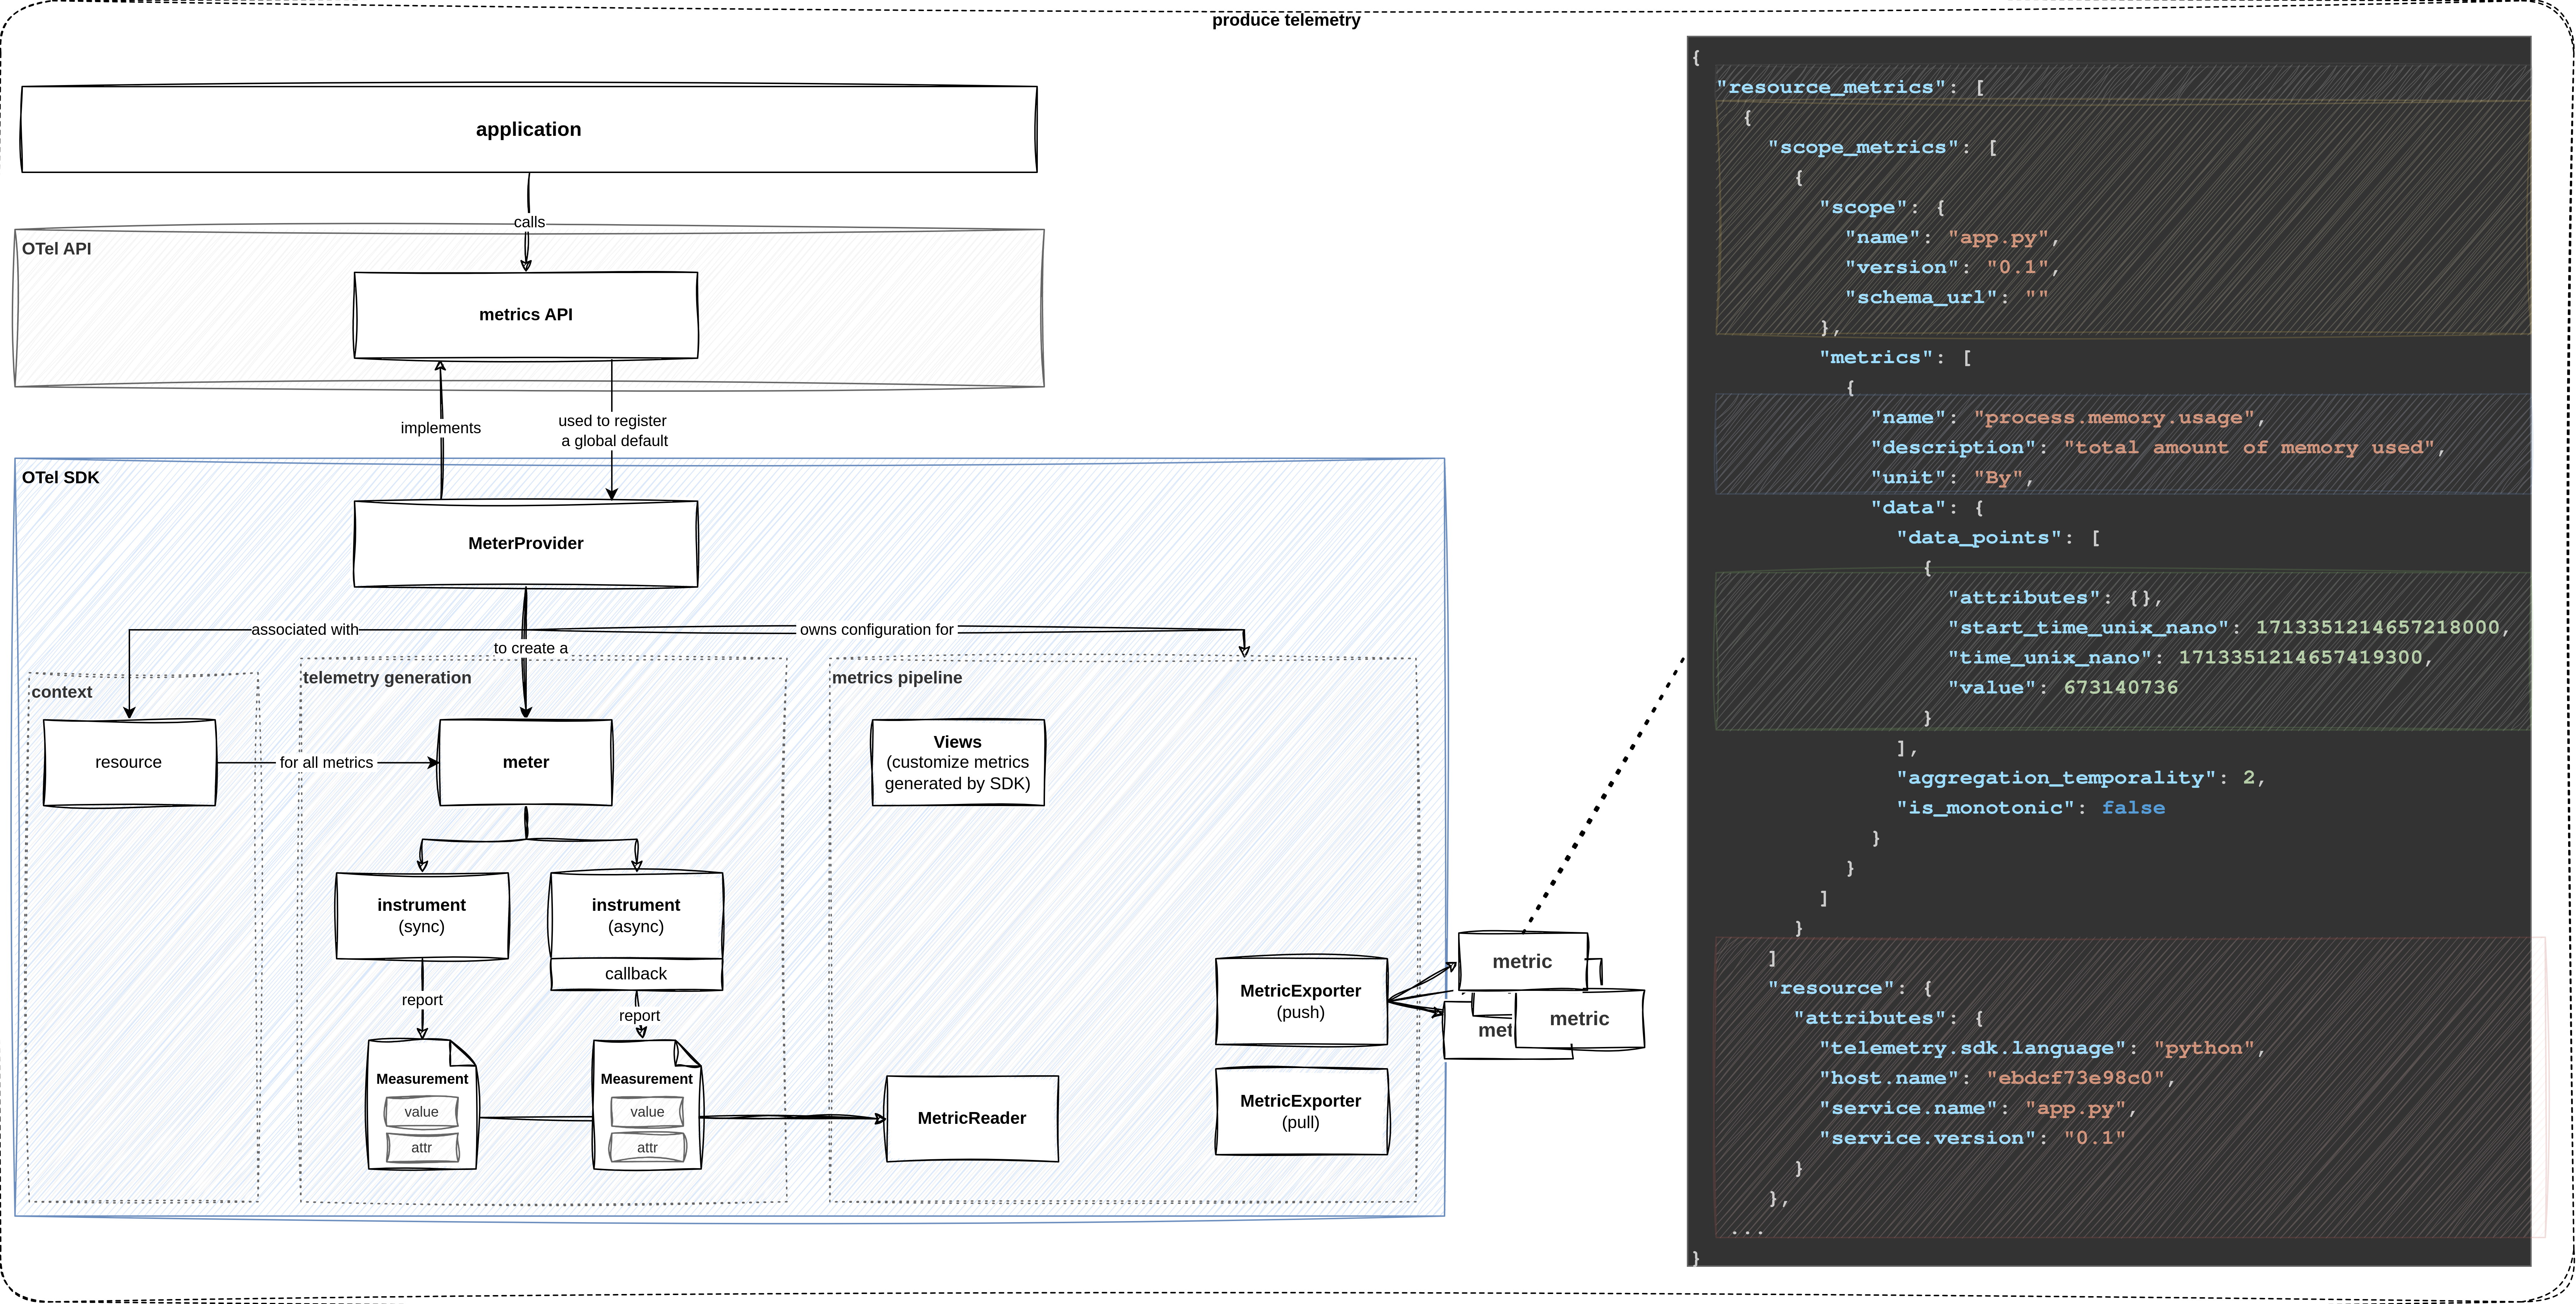
As usual, OpenTelemetry separates the API and the SDK.
The metrics API provides the interfaces that we use to instrument our application.
OpenTelemetry’s SDK ships with a official MeterProvider that implements the logic of the metrics signal.
To generate metrics, we first obtain a Meter which is used to create different types of instruments that report measurements.
After producing data, we must define a strategy for how metrics are sent downstream.
A MetricReader collects the measurements of associated instruments.
The paired MetricExporter is responsible for getting the data to the destination.
Learning Objectives
By the end of this lab, you will be able to:
- Use the OpenTelemetry API and configure the SDK to generate metrics
- Understand the basic structure and dimensions of a metric
- Generate custom metrics from your application and configure the exporting
How to perform the exercises
This lab exercise demonstrates how to collect metrics from a Java application. The purpose of the exercises is to learn about OpenTelemetry’s metrics signal.
In production, we typically collect, store and query metrics in a dedicated backend such as Prometheus.
In this lab, we output metrics to the local console to keep things simple.
The environment consists of a Java service that we want to instrument.
- This exercise is based on the following repository repository
- All exercises are in the subdirectory
exercises. There is also an environment variable$EXERCISESpointing to this directory. All directories given are relative to this one. - Initial directory:
manual-instrumentation-metrics-java/initial - Solution directory:
manual-instrumentation-metrics-java/solution - Java/Spring Boot backend component:
manual-instrumentation-metrics-java/initial/todobackend-springboot
The environment consists of one component:
- Spring Boot REST API service
- uses Spring Boot framework
- listens on port 8080 and serves several CRUD style HTTP endpoints
- simulates an application we want to instrument
To start with this lab, open two terminals.
- Terminal to run the echo server
Navigate to
cd $EXERCISES
cd manual-instrumentation-metrics-java/initial/todobackend-springboot
Run:
mvn spring-boot:run - Terminal to send request to the HTTP endpoints of the service
The directory doesn’t matter here
Test the Java app:
curl -XGET localhost:8080/todos/; echoYou should see a response of the following type:
[]To keep things concise, code snippets only contain what’s relevant to that step.
If you get stuck, you can find the solution in the exercises/manual-instrumentation-metrics-java/solution
Configure metrics pipeline and obtain a meter
Before we can make changes to the Java code we need to make sure some necessary dependencies are in place.
In the first window stop the app using Ctrl+C and edit the pom.xml file.
Add the following dependencies. Do not add the dots (…). Just embed the dependencies.
	<dependencies>
    ...
        <dependency>
            <groupId>io.opentelemetry</groupId>
            <artifactId>opentelemetry-api</artifactId>
        </dependency>
        <dependency>
            <groupId>io.opentelemetry</groupId>
            <artifactId>opentelemetry-sdk</artifactId>
        </dependency>
        <dependency>
            <groupId>io.opentelemetry</groupId>
            <artifactId>opentelemetry-exporter-logging</artifactId>
        </dependency>
        <dependency>
            <groupId>io.opentelemetry.semconv</groupId>
            <artifactId>opentelemetry-semconv</artifactId>
            <version>1.29.0-alpha</version>
        </dependency>
        ...
	</dependencies>
Within the same file add the following code snippet
<project>
...
    <dependencyManagement>
        <dependencies>
            <dependency>
                <groupId>io.opentelemetry</groupId>
                <artifactId>opentelemetry-bom</artifactId>
                <version>1.40.0</version>
                <type>pom</type>
                <scope>import</scope>
            </dependency>
        </dependencies>
    </dependencyManagement>
...
</project>
Within the folder of the main application file TodobackendApplication.java add a new file called OpenTelemetryConfiguration.java.
We’ll use it to separate tracing-related configuration from the main application. The folder is manual-instrumentation-metrics-java/initial/todobackend-springboot/src/main/java/io/novatec/todobackend. It is recommended to edit the file not via command line, but to use your built-in editor.
Add the following content to this file:
package io.novatec.todobackend;

import java.time.Duration;
import org.springframework.context.annotation.Bean;
import org.springframework.context.annotation.Configuration;

//Basic Otel API & SDK
import io.opentelemetry.api.OpenTelemetry;
import io.opentelemetry.sdk.OpenTelemetrySdk;
import io.opentelemetry.sdk.resources.Resource;
import io.opentelemetry.semconv.ServiceAttributes;

//Metrics
import io.opentelemetry.exporter.logging.LoggingMetricExporter;
import io.opentelemetry.sdk.metrics.SdkMeterProvider;
import io.opentelemetry.sdk.metrics.export.PeriodicMetricReader;

@Configuration
public class OpenTelemetryConfiguration {

    @Bean
	public OpenTelemetry openTelemetry() {

		Resource resource = Resource.getDefault().toBuilder()
                .put(ServiceAttributes.SERVICE_NAME, "todobackend")
                .put(ServiceAttributes.SERVICE_VERSION, "0.1.0")
                .build();

		SdkMeterProvider sdkMeterProvider = SdkMeterProvider.builder()
				.registerMetricReader(
					PeriodicMetricReader
						.builder(LoggingMetricExporter.create())
						.setInterval(Duration.ofSeconds(10))
						.build())
				.setResource(resource)
				.build();

		OpenTelemetry openTelemetry = OpenTelemetrySdk.builder()
            .setMeterProvider(sdkMeterProvider)
			.build();

		return openTelemetry;
	}

}
Let’s begin by importing OpenTelemetry’s meter API and the MeterProvider from the SDK in our main Java application as shown below.
Open TodobackendApplication.java in your editor and tart by adding the following import statements. Place them below the already existing ones:
import io.opentelemetry.api.OpenTelemetry;
import io.opentelemetry.api.common.Attributes;
import io.opentelemetry.api.metrics.LongCounter;
import io.opentelemetry.api.metrics.LongHistogram;
import io.opentelemetry.api.metrics.ObservableDoubleGauge;
import io.opentelemetry.api.metrics.Meter;

import static io.opentelemetry.api.common.AttributeKey.stringKey;
As a next step we reference the bean in the main application. Make sure the global variables at the top of the class are present:
public class TodobackendApplication {

	private Logger logger = LoggerFactory.getLogger(TodobackendApplication.class);

	private Meter meter;
We’ll use constuctor injection, so add the following constructor to the class, if it doesn’t exist yet. In this constuctor we instantiate the OpenTelemetry and Meter object and make them usable.
	public TodobackendApplication(OpenTelemetry openTelemetry) {

		meter = openTelemetry.getMeter(TodobackendApplication.class.getName());
	}
At this point it is recommended to rebuild and run the application to verify if all the changes have been applied correctly.
In your main terminal window run:
mvn spring-boot:run If there are any errors review the changes and repeat.
Generate metrics
To show a very simple form of metric collection we’ll try to define a counter for the amount of invocations of a REST call. We need to initialize the counter outside of this method.
So add a global variable to the class called:
private LongCounter counter;Initialize it in the constructor of the class:
	public TodobackendApplication(OpenTelemetry openTelemetry) {

        // ...

		counter = meter.counterBuilder("todobackend.requests.counter")
				.setDescription("How many times an endpoint has been invoked")
				.setUnit("requests")
				.build();
	}
Now that the application is ready to generate metrics let’s start focussing on the method to be instrumented.
Locate the addTodo method which initially looks like this:
    @PostMapping("/todos/{todo}")
    String addTodo(HttpServletRequest request, HttpServletResponse response, @PathVariable String todo){

        this.someInternalMethod(todo);

        logger.info("POST /todos/ "+todo.toString());

        return todo;
}
Add a single line here:
    @PostMapping("/todos/{todo}")
    String addTodo(HttpServletRequest request, HttpServletResponse response, @PathVariable String todo){

        counter.add(1);
        this.someInternalMethod(todo);

        logger.info("POST /todos/ "+todo.toString());

        return todo;
}
So whenever the method gets invoked the counter will be incremented by one. However, this applies only to this specific REST call.
Let’s test the behaviour. Go back to your terminal and execute the following command.
In case your application is not running anymore, start it in the first terminal:
mvn spring-boot:run In your second terminal issue the REST request again.
curl -XPOST localhost:8080/todos/NEW; echoObserve the logs in your main terminal, this should display something like:
2024-07-25T12:23:47.929Z  INFO 20323 --- [springboot-backend ] [nio-8080-exec-1] i.n.todobackend.TodobackendApplication   : GET /ping/tom
2024-07-25T12:23:54.267Z  INFO 20323 --- [springboot-backend ] [cMetricReader-1] i.o.e.logging.LoggingMetricExporter      : Received a collection of 1 metrics for export.
2024-07-25T12:23:54.267Z  INFO 20323 --- [springboot-backend ] [cMetricReader-1] i.o.e.logging.LoggingMetricExporter      : metric: ImmutableMetricData{resource=Resource{schemaUrl=null, attributes={service.name="todobackend", service.version="0.1.0", telemetry.sdk.language="java", telemetry.sdk.name="opentelemetry", telemetry.sdk.version="1.40.0"}}, instrumentationScopeInfo=InstrumentationScopeInfo{name=io.novatec.todobackend.TodobackendApplication, version=null, schemaUrl=null, attributes={}}, name=todobackend.requests.counter, description=How many times the GET call has been invoked., unit=requests, type=LONG_SUM, data=ImmutableSumData{points=[ImmutableLongPointData{startEpochNanos=1721910224265851430, epochNanos=1721910234267050129, attributes={}, value=1, exemplars=[]}], monotonic=true, aggregationTemporality=CUMULATIVE}}
The second line of logs written by the LoggingMetricExporter contains the information we just generated: value=1.
You will probably notice that this logging is continuously repeated (every 10 seconds).
This happens because we specified this behaviour in the configuration class:
		SdkMeterProvider sdkMeterProvider = SdkMeterProvider.builder()
				.registerMetricReader(
					PeriodicMetricReader
						.builder(LoggingMetricExporter.create())
						.setInterval(Duration.ofSeconds(10)) // <-- reading interval
						.build())
				.setResource(resource)
				.build();
The standard interval is 60 seconds. We apply 10 seconds here for demo purposes.
Now, let’s generate some more invocations in the other terminal window:
curl -XPOST localhost:8080/todos/NEW; echo
curl -XPOST localhost:8080/todos/NEW; echo
curl -XPOST localhost:8080/todos/NEW; echo
curl -XPOST localhost:8080/todos/NEW; echo
With the next log statement in the main application window you should now see the value counts up to 5 now.
Metric dimensions
The API also provides the possibility to add attributes to the metric data.
Change the counter statement in the following way:
    import java.util.jar.Attributes;

@PostMapping("/todos/{todo}")
String addTodo(HttpServletRequest request, HttpServletResponse response, @PathVariable String todo) {

  counter.add(1, Attributes.of(stringKey("todo"), todo));
  // ...
}
Again, let’s generate some more invocations in another terminal window. This time use different paths like:
curl -XPOST localhost:8080/todos/NEW; echo
curl -XPOST localhost:8080/todos/fail; echo
2024-07-25T12:50:09.567Z INFO 20323 --- [springboot-backend ] [cMetricReader-1] i.o.e.logging.LoggingMetricExporter : metric: ImmutableMetricData{resource=Resource{schemaUrl=null, attributes={service.name="todobackend", service.version="0.1.0", telemetry.sdk.language="java", telemetry.sdk.name="opentelemetry", telemetry.sdk.version="1.40.0"}}, instrumentationScopeInfo=InstrumentationScopeInfo{name=io.novatec.todobackend.TodobackendApplication, version=null, schemaUrl=null, attributes={}}, name=todobackend.requests.counter, description=How many times the GET call has been invoked., unit=requests, type=LONG_SUM, data=ImmutableSumData{points=[ImmutableLongPointData{startEpochNanos=1739878114992659966, epochNanos=1739878504997396355, attributes={todo="NEW"}, value=1, exemplars=[]}, ImmutableLongPointData{startEpochNanos=1739878114992659966, epochNanos=1739878504997396355, attributes={todo="fail"}, value=1, exemplars=[]}], monotonic=true, aggregationTemporality=CUMULATIVE}}The attributes are now listed, too. Do you notice something?
..., attributes={todo="NEW"}, value=1, ..., attributes={todo="fail"}, value=1, ...We can conclude that the instrument reports separate counters for each unique combination of attributes. This can be incredibly useful. For example, if we pass the status code of a request as an attribute, we can track distinct counters for successes and errors. While it is tempting to be more specific, we have to be careful with introducing new metric dimensions. The number of attributes and the range of values can quickly lead to many unique combinations. High cardinality means we have to keep track of numerous distinct time series, which leads to increased storage requirements, network traffic, and processing overhead. Moreover, specific metrics may have less aggregative quality, which can make it harder to derive meaningful insights.
In conclusion, the selection of metric dimensions is a delicate balancing act. Metrics with high cardinality can lead to numerous unique combinations. They result from introducing many attributes or a wide range of values, like IDs or error messages. This can increase storage requirements, network traffic, and processing overhead, as each unique combination of attributes represents a distinct time series that must be tracked. Moreover, metrics with low aggregative quality may be less useful when aggregated, making it more challenging to derive meaningful insights from the data. Therefore, it is essential to carefully consider the dimensions of the metrics to ensure that they are both informative and manageable within the constraints of the monitoring system.
Instruments
We’ve used a simple counter instrument to generate a metric. The API however is capable of more here.
So far, everything was fairly similar to the tracing lab. In contrast to tracers however, we do not use meters directly to generate metrics.
Instead, meters produce (and are associated with) a set of instruments.
An instrument reports measurements, which represent a data point reflecting the state of a metric at a particular
point in time. So a meter can be seen as a factory for creating instruments and is associated with a specific
library or module in your application. Instruments are the objects that you use to record metrics and represent
specific metric types, such as counters, gauges, or histograms. Each instrument has a unique name and is associated
with a specific meter. Measurements are the individual data points that instruments record, representing the
current state of a metric at a specific moment in time. Data points are the aggregated values of measurements over
a period of time, used to analyze the behavior of a metric over time, such as identifying trends or anomalies.
To illustrate this, consider a scenario where you want to measure the number of requests to a web server. You would use a meter to create an instrument, such as a counter, which is designed to track the number of occurrences of an event. Each time a request is made to the server, the counter instrument records a measurement, which is a single data point indicating that a request has occurred. Over time, these measurements are aggregated into data points, which provide a summary of the metric’s behavior, such as the total number of requests received.
overview of different instruments
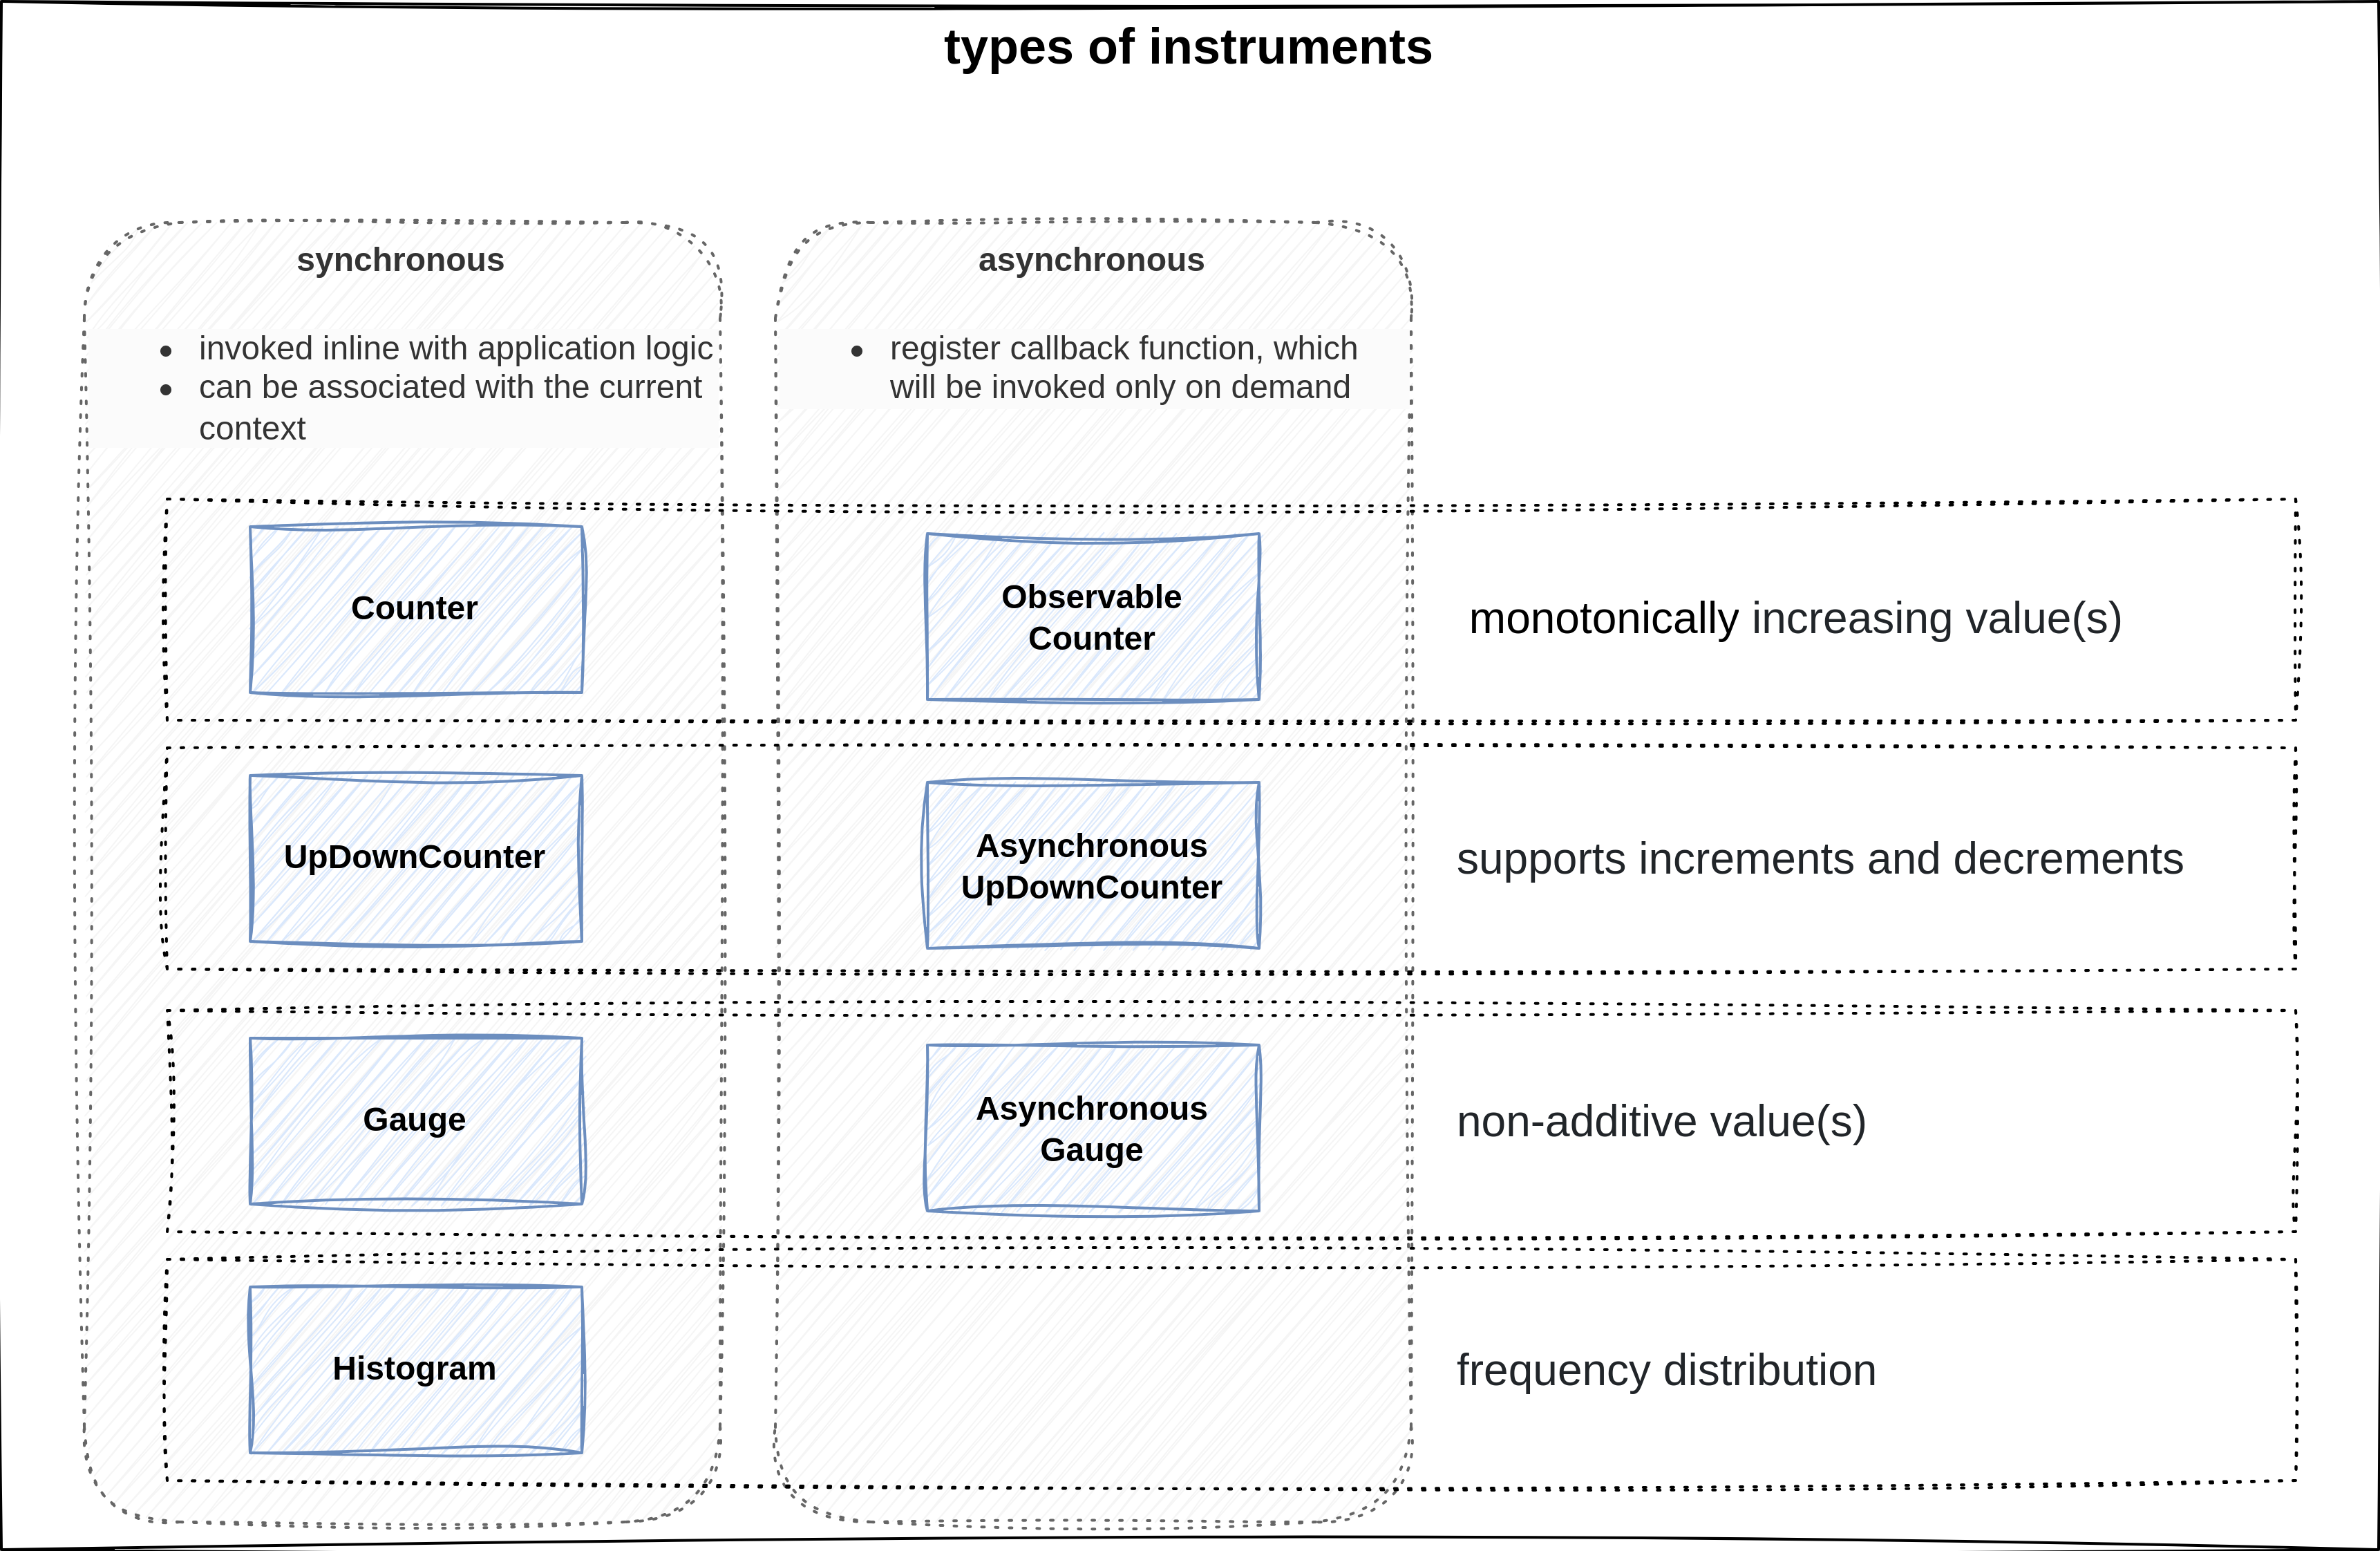
Similar to the real world, there are different types of instruments depending on what you try to measure. OpenTelemetry provides different types of instruments to measure various aspects of your application. For example:
Countersare used for monotonically increasing values, such as the total number of requests handled by a server.UpAndDownCountersare used to track values that can both increase and decrease, like the number of active connections to a databaseGaugeinstruments reflect the state of a value at a given time, such as the current memory usage of a process.Histogram(https://opentelemetry.io/docs/specs/otel/metrics/data-model/#histogram) instruments are used to analyze the distribution of how frequently a value occurs, which can help identify trends or anomalies in the data.
Each type of instrument, except for histograms, has a synchronous and asynchronous variant. Synchronous instruments are invoked in line with the application code, while asynchronous instruments register a callback function that is invoked on demand. This allows for more efficient and flexible metric collection, especially in scenarios where the metric value is expensive to compute or when the metric value changes infrequently.
Measure golden signals
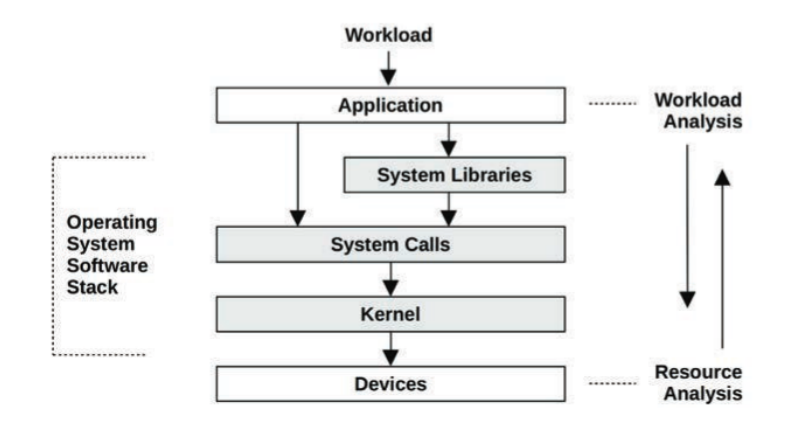
workload and resource analysis
Now, let’s put our understanding of the metrics signal to use. Before we do that, we must address an important question: What do we measure? Unfortunately, the answer is anything but simple. Due to the vast amount of events within a system and many statistical measures to calculate, there are nearly infinite things to measure. A catch-all approach is cost-prohibitive from a computation and storage point, increases the noise which makes it harder to find important signals, leads to alert fatigue, and so on. The term metric refers to a statistic that we consciously chose to collect because we deem it to be important. Important is a deliberately vague term, because it means different things to different people. A system administrator typically approaches an investigation by looking at the utilization or saturation of physical system resources. A developer is usually more interested in how the application responds, looking at the applied workload, response times, error rates, etc. In contrast, a customer-centric role might look at more high-level indicators related to contractual obligations (e.g. as defined by an SLA), business outcomes, and so on. The details of different monitoring perspectives and methodologies (such as USE and RED) are beyond the scope of this lab. However, the four golden signals of observability often provide a good starting point:
- Traffic: volume of requests handled by the system
- Errors: rate of failed requests
- Latency: the amount of time it takes to serve a request
- Saturation: how much of a resource is being consumed at a given time
We have already shown how to measure the total amount of traffic in the previous chapters. Thus, let’s continue with the remaining signals.
Error rate
As a next step, let’s track the error rate of creating new todos. Create a separate Counter instrument. Ultimately, the decision of what constitutes a failed request is up to us. In this example, we’ll simply refer to the name of the todo.
First, add another global variable to the class called:
private LongCounter errorCounter;Initialize it in the constructor of the class:
	public TodobackendApplication(OpenTelemetry openTelemetry) {

        // ...

        errorCounter = meter.counterBuilder("todobackend.requests.errors")
				.setDescription("How many times an error occurred")
				.setUnit("requests")
				.build();
	}
Then include the errorCounter inside someInternalMethod like this:
	String someInternalMethod(String todo) {

     //...

      if(todo.equals("fail")){

        errorCounter.add(1);
        System.out.println("Failing ...");
        throw new RuntimeException();
      }

      return todo;
}
Restart the app. When sending a fail request, you will see the error counter in the log output
curl -XPOST localhost:8080/todos/fail; echoLatency
The time it takes a service to process a request is a crucial indicator of potential problems. The tracing lab showed that spans contain timestamps that measure the duration of an operation. Traces allow us to analyze latency in a specific transaction. However, in practice, we often want to monitor the overall latency for a given service. While it is possible to compute this from span metadata, converting between telemetry signals is not very practical. For example, since capturing traces for every request is resource-intensive, we might want to use sampling to reduce overhead. Depending on the strategy, sampling may increase the probability that outlier events are missed. Therefore, we typically analyze the latency via a Histogram. Histograms are ideal for this because they represent a frequency distribution across many requests. They allow us to divide a set of data points into percentage-based segments, commonly known as percentiles. For example, the 95th percentile latency (P95) represents the value below which 95% of response times fall. A significant gap between P50 and higher percentiles suggests that a small percentage of requests experience longer delays. A major challenge is that there is no unified definition of how to measure latency. We could measure the time a service spends processing application code, the time it takes to get a response from a remote service, and so on. To interpret measurements correctly, it is vital to have information on what was measured.
Let’s use the meter to create a Histogram instrument. Refer to the semantic conventions for HTTP Metrics for an instrument name and preferred unit of measurement. To measure the time it took to serve the request, we’ll create a timestamp at the beginning at the method and calculate the difference from the timestamp at the end of the method.
First, add a global variable:
private LongHistogram requestDuration;Then initialize the instrument in the constructor:
    public TodobackendApplication(OpenTelemetry openTelemetry) {

        // ...

        requestDuration = meter.histogramBuilder("http.server.request.duration")
            .setDescription("How long was a request processed on server side")
            .setUnit("ms")
            .ofLongs()
            .build();
    }
Finally, calculate the request duration in the method addTodo, like this:
    @PostMapping("/todos/{todo}")
    String addTodo(HttpServletRequest request, HttpServletResponse response, @PathVariable String todo){

        long start = System.currentTimeMillis();

        // ...

        long duration = System.currentTimeMillis() - start;
        requestDuration.record(duration);
        return todo;
    }
Again, restart the app. Try out different paths:
curl -XPOST localhost:8080/todos/NEW; echo
curl -XPOST localhost:8080/todos/NEW; echo
curl -XPOST localhost:8080/todos/slow; echo
curl -XPOST localhost:8080/todos/slow; echo
The output will include a message like this:
... data=ImmutableHistogramData{aggregationTemporality=CUMULATIVE, points=[ImmutableHistogramPointData{getStartEpochNanos=1739887391007239250, getEpochNanos=1739887611011912531, getAttributes={}, getSum=2076.0, getCount=4, hasMin=true, getMin=3.0, hasMax=true, getMax=1005.0, getBoundaries=[0.0, 5.0, 10.0, 25.0, 50.0, 75.0, 100.0, 250.0, 500.0, 750.0, 1000.0, 2500.0, 5000.0, 7500.0, 10000.0], getCounts=[0, 1, 0, 0, 0, 1, 0, 0, 0, 0, 0, 2, 0, 0, 0, 0] ...Histograms do not store their values explicitly, but implicitly through aggregations (sum, count min, max) and buckets. Normally, we are not interested in the exact measured values, but the boundaries within which they lie. Thus, we define buckets via those mentioned (upper) boundaries and count how many values are measured within these buckets. The boundaries are inclusive.
In the example above we can read there was one request taking between 0 and 5 ms, another request taking within 75 to 100 ms and two requests taking between 1000 and 2500 ms.
Note: Since the first upper boundary is 0.0, the first bucket is reserved only for the value 0. Furthermore, there are actually 16 buckets for 15 upper boundaries. There is always one implicit upper boundary for values exceeding the last explicit boundary. In this case, values greater than 10000. You could call this last bucket the Inf+ bucket.
Saturation
All the previous metrics have been request-oriented. For completeness, we’ll also capture some resource-oriented metrics. According to Google’s SRE book, the fourth golden signal is called “saturation”. Unfortunately, the terminology is not well-defined. Brendan Gregg, a renowned expert in the field, defines saturation as the amount of work that a resource is unable to service. In other words, saturation is a backlog of unprocessed work. An example of a saturation metric would be the length of a queue. In contrast, utilization refers to the average time that a resource was busy servicing work. We usually measure utilization as a percentage over time. For example, 100% utilization means no more work can be accepted. If we go strictly by definition, both terms refer to separate concepts. One can lead to the other, but it doesn’t have to. It would be perfectly possible for a resource to experience high utilization without any saturation. However, Google’s definition of saturation, confusingly, resembles utilization. Let’s put the matter of terminology aside.
Let’s measure the system cpu utilization. There is already a method getCpuLoad prepared,
which allows us to record values via gauge.
Add another global variable:
private ObservableDoubleGauge cpuLoad;Then initialize the instrument in the constructor. This time we will use a callback function to record values.
This callback function will be called everytime, the MetricReader observes the gauge instrument.
As mentioned above, we have already configured a reading interval of 10s.
    public TodobackendApplication(OpenTelemetry openTelemetry) {

        // ...

        cpuLoad = meter.gaugeBuilder("system.cpu.utilization")
            .setDescription("The current system cpu utilization")
            .setUnit("percent")
            .buildWithCallback((measurement) -> measurement.record(this.getCpuLoad()));
    }
That’s it! We do not have to inline the instrument into any method, because of the callback function.
Restart the app once more and wait until the MetricReader observes the gauge instrument.
The log output will be written automatically.
Run the ab command to apply load on the system. Examine the metrics rendered to the terminal.
# apache bench
ab -n 50000 -c 100 http://localhost:8080/todos
Views
So far, we have seen how to generate some metrics.
Views let us customize how metrics are collected and output by the SDK.
A view consists of two parts. First, you have to specify on which instruments the view should be applied via
the InstrumentSelector.
Second, you define how the view should affect the selected instruments.
You can select multiple instruments per view. Likewise, there are multiple views allowed to be registered for one instrument.
Measurements are only exported, if there is at least one view defining an aggregation for them.
Since we haven’t defined any view yet, how have we managed to export measurements into the terminal?
The reason for that are the default aggregations for each instrument.
For instance, a counter performs a SumAggregation, while a gauge defaults to LastValueAggregation.
Views are much more powerful than just changing the instrument’s aggregation. For example, we can specify a condition, to filter for attribute keys. An operator might want to drop metric dimensions because they are deemed unimportant, to reduce memory usage and storage, prevent leaking sensitive information, and so on. If we pass an always failing condition, the SDK will no longer report separate counter for different URL paths. Moreover, if we pass Aggregation.drop() into a view, the SDK will ignore all measurements from the matched instruments. You have now seen some basic examples of how views let us match instruments and customize the metrics stream.
First you have to import some more classes:
import io.opentelemetry.sdk.metrics.InstrumentSelector;
import io.opentelemetry.sdk.metrics.View;
import io.opentelemetry.sdk.metrics.InstrumentType;
import io.opentelemetry.sdk.metrics.Aggregation;
To add some views, you have to register them before building the MeterProvider in OpenTelemetryConfiguration.java.
        SdkMeterProvider sdkMeterProvider = SdkMeterProvider.builder()
                // ...
                .registerView(
                        InstrumentSelector.builder().setName("todobackend.requests.counter").build(),
                        View.builder().setName("test-view").build() // Rename measurements
                )
                .registerView(
                        InstrumentSelector.builder().setName("todobackend.requests.counter").build(),
                        View.builder().setAttributeFilter((attr) -> false).build() // Remove attributes
                )
                .registerView(
                        InstrumentSelector.builder().setType(InstrumentType.OBSERVABLE_GAUGE).build(),
                        View.builder().setAggregation(Aggregation.drop()).build() // Drop measurements
                )
                .build();
After restarting the application, examine the different output when sending requests.
curl -XPOST localhost:8080/todos/NEW; echo
curl -XPOST localhost:8080/todos/slow; echo