Traces
Introduction
Overview
Overview of OpenTelemetry’s tracing signal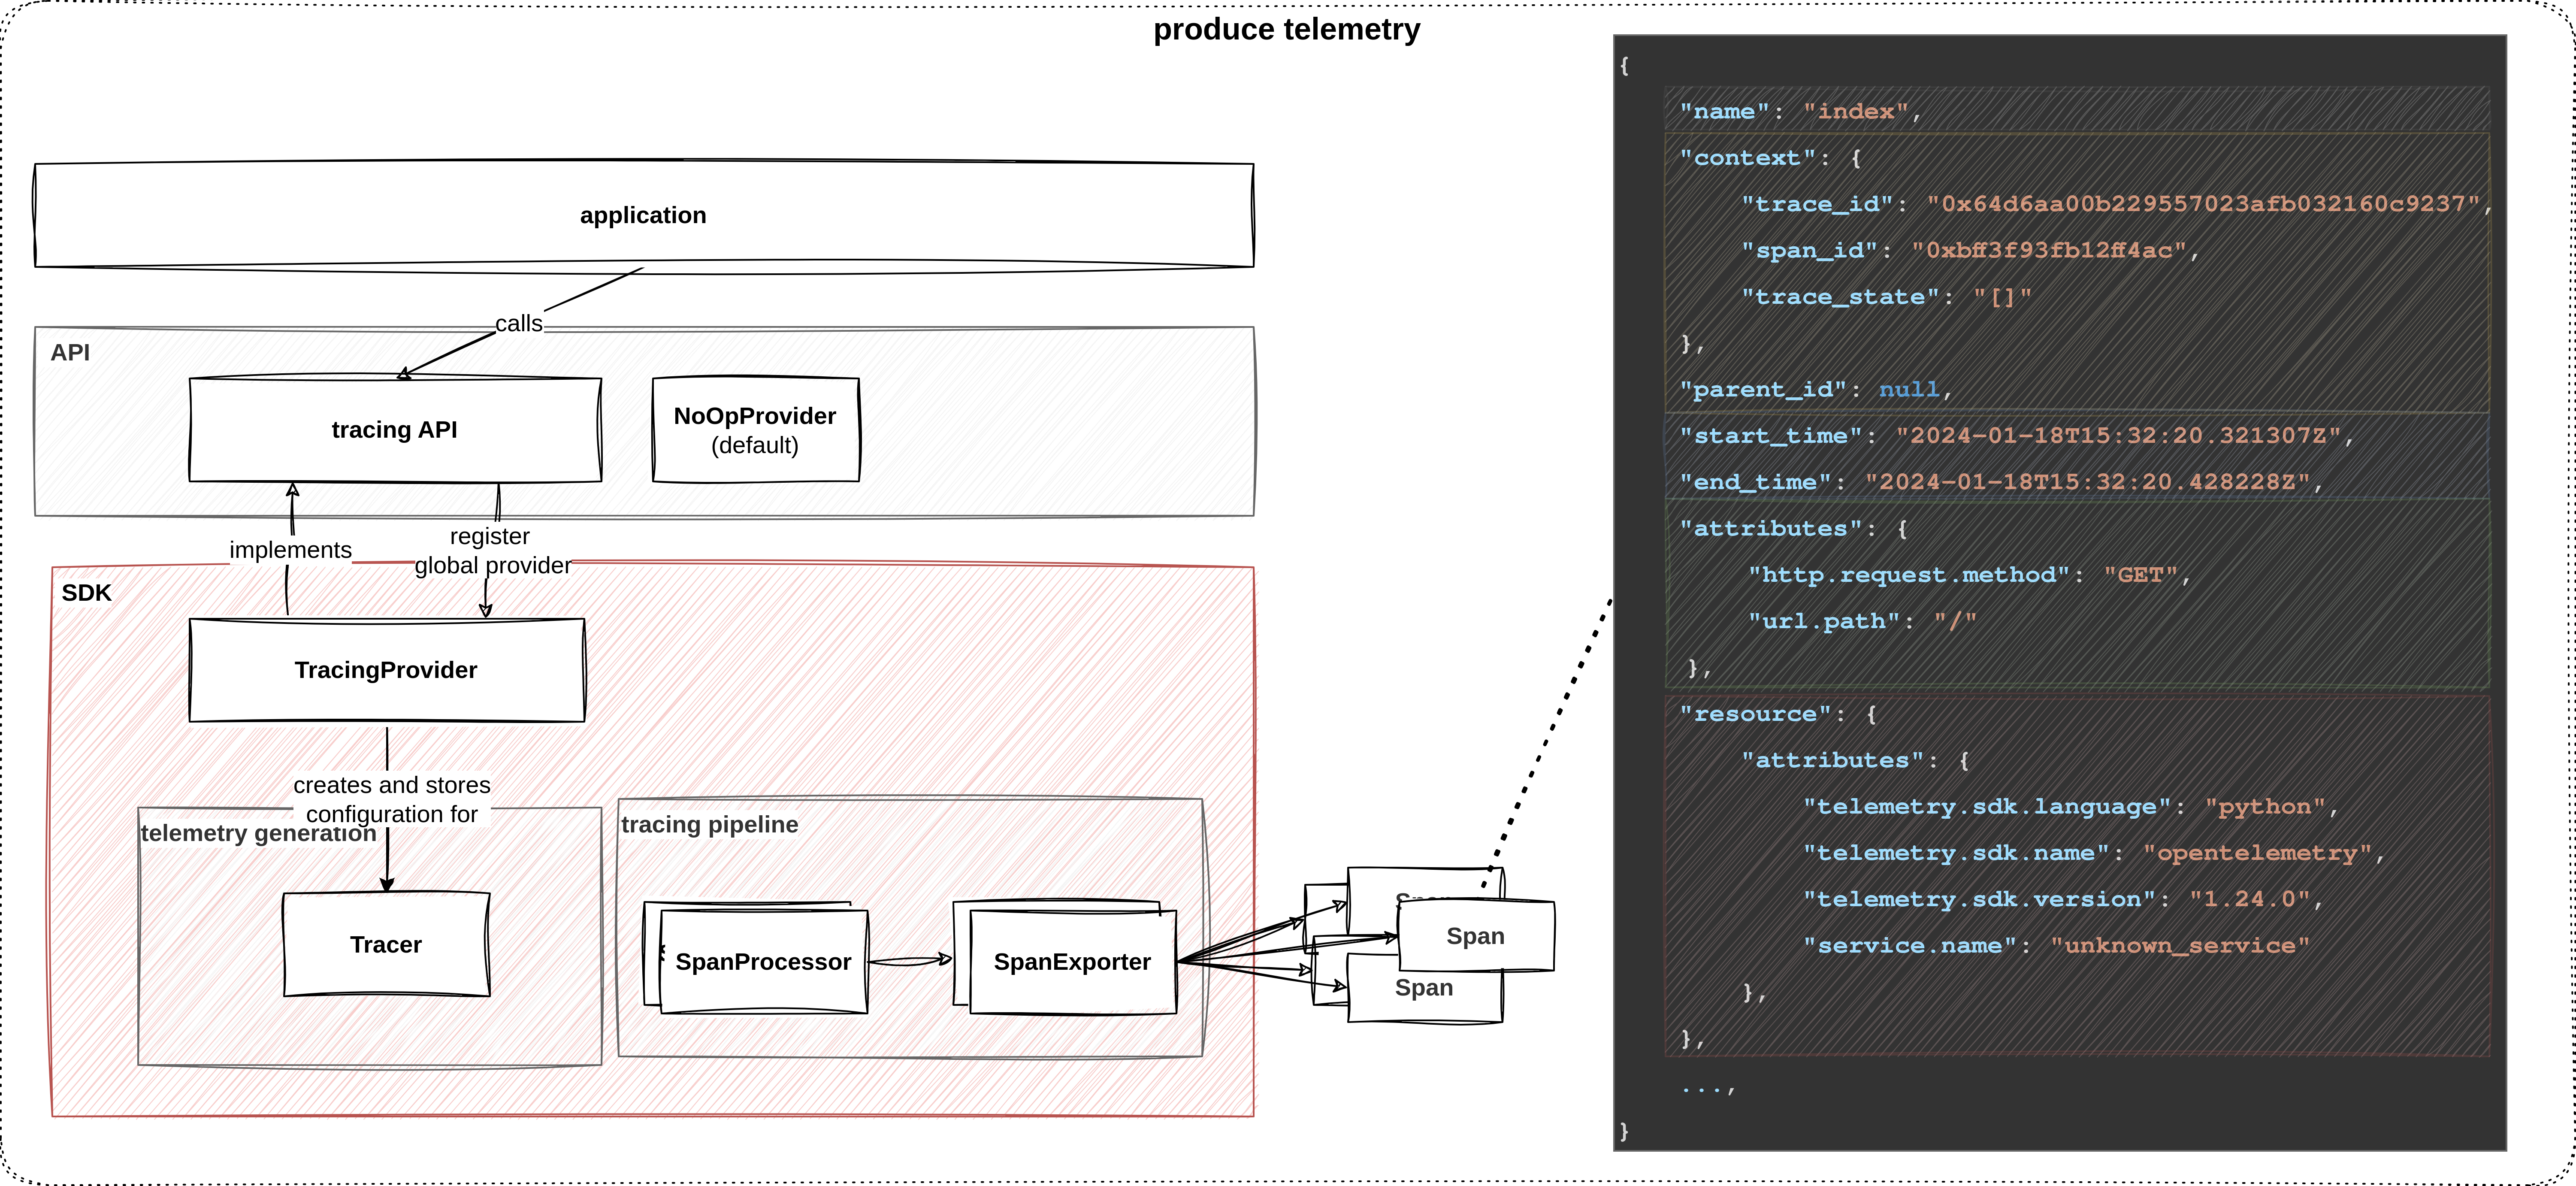
TracingProvider, which contains the logic that implements the tracing API.
We’ll use it to create a Tracer and configure a tracing pipeline (within the SDK).
The application uses the tracer to generate spans.
The tracing pipeline consists of one (or more) SpanProcessor and SpanExporters, which define how spans are processed and forwarded.
This lab exercise demonstrates how to add tracing instrumentation to a Java/Spring Boot application. The purpose of the exercises is to learn about the anatomy of spans and OpenTelemetry’s tracing signal. It does not provide a realistic deployment scenario. In this lab, we output spans to the local console to keep things simple and export it to Jaeger to show multiple ways of exporting.
Learning Objectives
By the end of this lab, you will be able to:
- Apply manual instrumentation for tracing to a Java application
- Use the OpenTelemetry API and configure the SDK to generate spans
- Understand the basic structure of a span
- Enrich spans with additional metadata
- Use the appropriate SDK objects to configure exporting to both console and Jaeger/OTLP
How to perform the exercises
- This exercise is based on the following repository repository
- All exercises are in the subdirectory
exercises. There is also an environment variable$EXERCISESpointing to this directory. All directories given are relative to this one. - Initial directory:
manual-instrumentation-traces-java/initial - Solution directory:
manual-instrumentation-traces-java/solution - Java/Spring Boot backend component:
manual-instrumentation-traces-java/initial/todobackend-springboot
The environment consists of one component:
- Spring Boot REST API service
- uses Spring Boot framework
- listens on port 8080 and serves several CRUD style HTTP endpoints
- simulates an application we want to instrument
To start with this lab, open two terminals.
- Terminal to run the echo server
Navigate to
cd $EXERCISES
cd manual-instrumentation-traces-java/initial/todobackend-springboot
Run:
mvn spring-boot:run - Terminal to send request to the HTTP endpoints of the service
The directory doesn’t matter here
Test the Java app:
curl -XGET localhost:8080/todos/; echoYou should see a response of the following type:
[]To keep things concise, code snippets only contain what’s relevant to that step.
If you get stuck, you can find the solution in the exercises/manual-instrumentation-traces-java/solution
Configure the tracing pipeline and obtain a tracer
The application has not been modified for OpenTelemetry, so we start entirely from scratch. Before we can make changes to the Java code we need to add some necessary dependencies.
In the first window stop the app using Ctrl+C and edit the pom.xml file.
Add the following dependencies. Do not add the dots (…). Just embed the dependencies.
	<dependencies>
    ...
        <dependency>
            <groupId>io.opentelemetry</groupId>
            <artifactId>opentelemetry-api</artifactId>
        </dependency>
        <dependency>
            <groupId>io.opentelemetry</groupId>
            <artifactId>opentelemetry-sdk</artifactId>
        </dependency>
        <dependency>
            <groupId>io.opentelemetry</groupId>
            <artifactId>opentelemetry-exporter-logging</artifactId>
        </dependency>
        <dependency>
            <groupId>io.opentelemetry</groupId>
            <artifactId>opentelemetry-exporter-otlp</artifactId>
        </dependency>
        <dependency>
            <groupId>io.opentelemetry.semconv</groupId>
            <artifactId>opentelemetry-semconv</artifactId>
            <version>1.29.0-alpha</version>
        </dependency>
        ...
	</dependencies>
Within the same file add the following code snippet
<project>
...
    <dependencyManagement>
        <dependencies>
            <dependency>
                <groupId>io.opentelemetry</groupId>
                <artifactId>opentelemetry-bom</artifactId>
                <version>1.40.0</version>
                <type>pom</type>
                <scope>import</scope>
            </dependency>
        </dependencies>
    </dependencyManagement>
...
</project>
Within the folder of the main application file TodobackendApplication.java add a new file called OpenTelemetryConfiguration.java.
We’ll use it to separate tracing-related configuration from the main application. The folder is manual-instrumentation-traces-java/initial/todobackend-springboot/src/main/java/io/novatec/todobackend.
It is recommended to edit the file not via command line, but to use your built-in editor.
Add the following content to this file:
package io.novatec.todobackend;

import org.springframework.context.annotation.Bean;
import org.springframework.context.annotation.Configuration;

//Basic Otel API & SDK
import io.opentelemetry.api.OpenTelemetry;
import io.opentelemetry.sdk.OpenTelemetrySdk;
import io.opentelemetry.sdk.resources.Resource;
import io.opentelemetry.semconv.ServiceAttributes;

//Tracing and Spans
import io.opentelemetry.sdk.trace.SdkTracerProvider;
import io.opentelemetry.sdk.trace.export.SimpleSpanProcessor;
import io.opentelemetry.exporter.logging.LoggingSpanExporter;

@Configuration
public class OpenTelemetryConfiguration {

    @Bean
	public OpenTelemetry openTelemetry() {

		Resource resource = Resource.getDefault().toBuilder()
                .put(ServiceAttributes.SERVICE_NAME, "todobackend")
                .put(ServiceAttributes.SERVICE_VERSION, "0.1.0")
                .build();

		SdkTracerProvider sdkTracerProvider = SdkTracerProvider.builder()
			.addSpanProcessor(SimpleSpanProcessor.create(LoggingSpanExporter.create()))
			.setResource(resource)
			.build();

		OpenTelemetry openTelemetry = OpenTelemetrySdk.builder()
			.setTracerProvider(sdkTracerProvider)
			.build();

		return openTelemetry;
	}

}
Explanation about the contents of this file:
This Configuration class will create a Bean to access OpenTelemetry API functionality. It is an initial configuration for tracing properties only.
For easy debugging purposes, we’ll instantiate a LoggingSpanExporter to output spans to the local console.
Next, we have to create a SpanProcessor to push generated spans to the SpanExporter.
Here, we can choose between two categories:
- synchronous (i.e. SimpleSpanProcessor)
- blocks the program execution to forward spans as soon as they are generated
- real-time, but means that instrumentation increases latency of requests
- asynchronous (i.e. BatchSpanProcessor)
- application starts and closes spans, but immediately resumes execution
- completed spans are maintained in a buffer, a separate thread flushes batches of spans at regular intervals
- has performance advantages, but spans might be dropped (because the application crashes before spans are exported, spans exceed the buffer capacity)
We created a SimpleSpanProcessor and pass the exporter to the create method to connect both.
It is recommended to keep this file open in the editor as there will be addition to it over the course of this exercise.
Let’s begin by importing OpenTelemetry’s tracing API and the TracerProvider from the SDK in our main Java application as shown below.
Open TodobackendApplication.java in your editor and tart by adding the following import statements.
Place them below the already existing ones:
import io.opentelemetry.api.OpenTelemetry;
import io.opentelemetry.api.trace.Tracer;

import io.opentelemetry.api.trace.Span;
import io.opentelemetry.api.trace.SpanKind;
import io.opentelemetry.api.trace.StatusCode;
import io.opentelemetry.api.common.Attributes;
import io.opentelemetry.context.Context;
import io.opentelemetry.context.Scope;

import static io.opentelemetry.api.common.AttributeKey.booleanKey;
As a next step we reference the bean in the main application.
Add two global variables at the top of the class:
public class TodobackendApplication {

	private Logger logger = LoggerFactory.getLogger(TodobackendApplication.class);

	private Tracer tracer;
We’ll use constructor injection, so add the following constructor to the class, too. In this constructor we instantiate the OpenTelemetry and Tracer object and make them usable.
	public TodobackendApplication(OpenTelemetry openTelemetry) {

		tracer = openTelemetry.getTracer(TodobackendApplication.class.getName(), "0.1.0");
	}
At this point it is recommended to rebuild and run the application to verify if all the changes have been applied correctly.
In your main terminal window run:
mvn spring-boot:run If there are any errors review the changes and repeat.
Generate spans
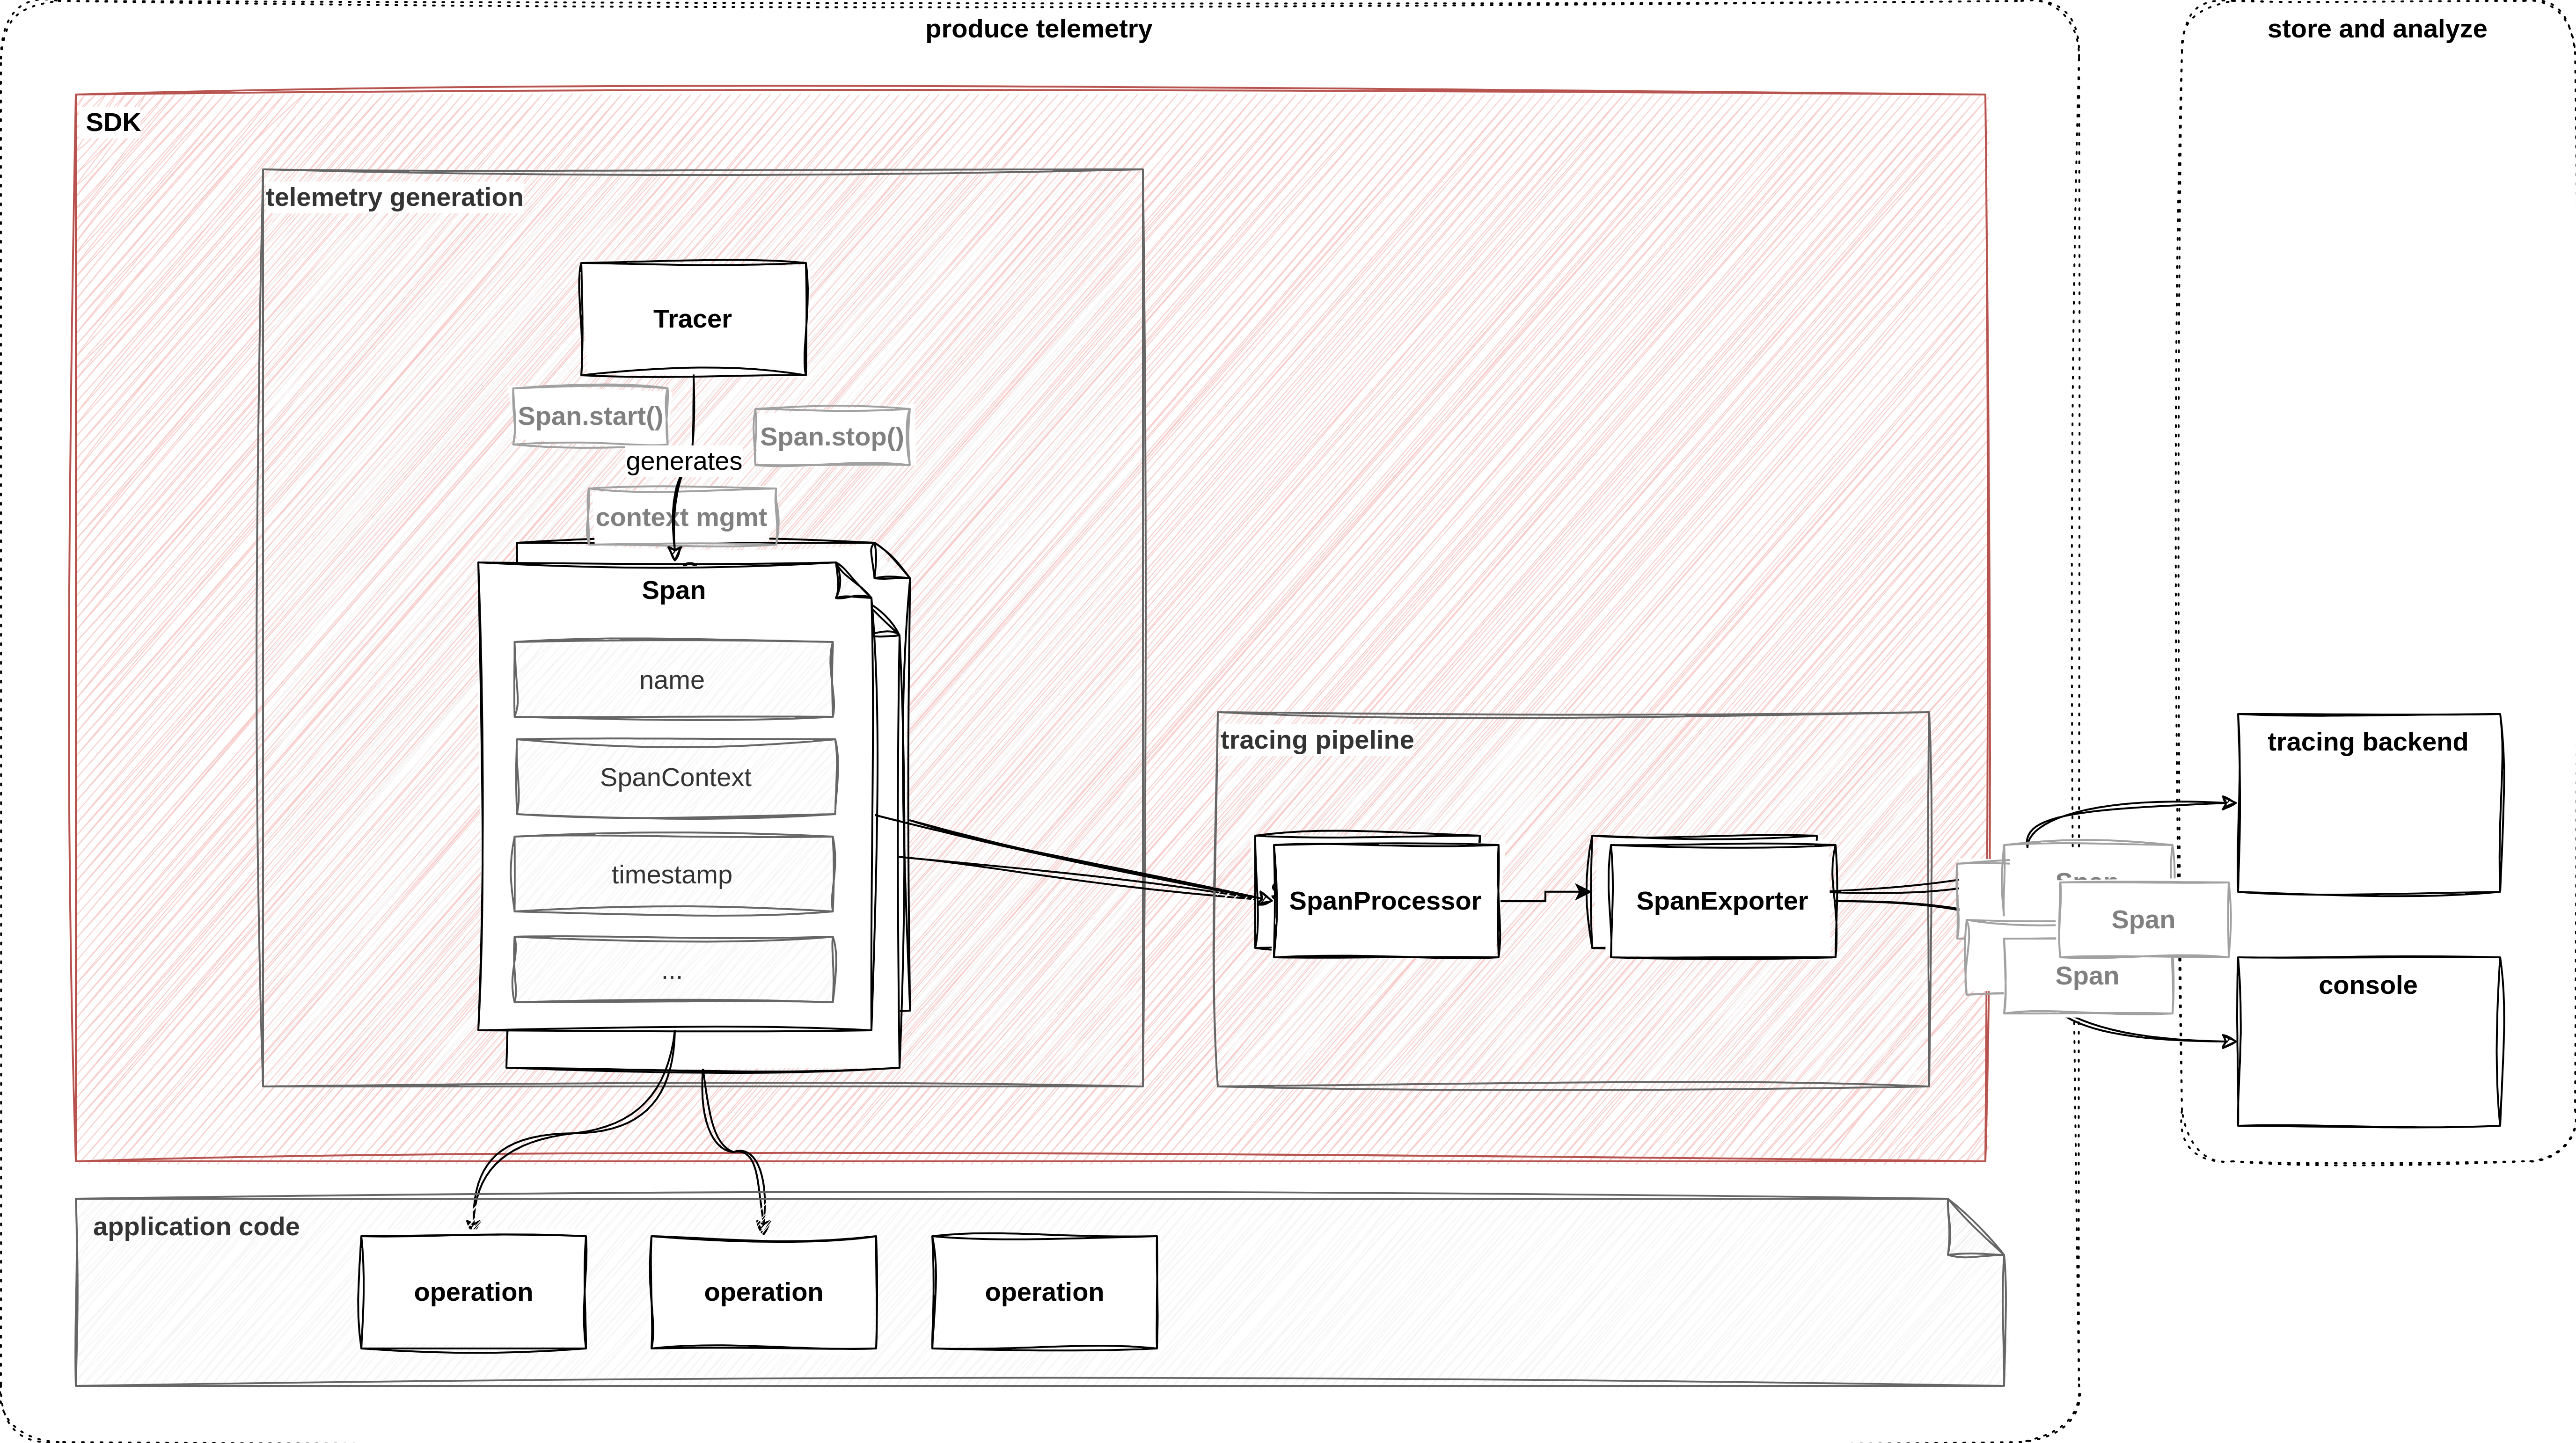
Tracing signal
Now that the application is ready to generate traces let’s start focussing on the method to be instrumented.
Locate the addTodo method which initially looks like this:
	@PostMapping("/todos/{todo}")
	String addTodo(HttpServletRequest request, HttpServletResponse response, @PathVariable String todo){

		this.someInternalMethod(todo);

		logger.info("POST /todos/ "+todo.toString());

		return todo;
	}
With the help of a tracer, let’s generate our first piece of telemetry. On a high level, we must add instrumentation to our code that creates and finishes spans. OpenTelemetry’s Java implementation provides ways to do this.
Add two instructions at the beginning and end of the method to start and stop the span. The resulting code is supposed to look like this:
	@PostMapping("/todos/{todo}")
	String addTodo(HttpServletRequest request, HttpServletResponse response, @PathVariable String todo){

		Span span = tracer.spanBuilder("addTodo").startSpan();

		this.someInternalMethod(todo);
		logger.info("POST /todos/ "+todo.toString());

		span.end();

		return todo;
	}
As you can see we referenced the tracer object which was initialized in the constructor and passed a String to the spanBuilder method, which will later be the name of the span.
Stop, rebuild and restart the application:
mvn spring-boot:run Switch to your other terminal and use the following command to send a request to the / endpoint:
curl -XPOST localhost:8080/todos/NEW; echoThis causes the tracer to generate a span object, for which the tracing pipeline writes a logging statement into the application log. Take a look at the terminal where you application is running. You should see a log statement similar to the one shown below.
2024-07-21T12:58:04.842Z INFO 23816 --- [springboot-backend ] [nio-8080-exec-1] i.o.e.logging.LoggingSpanExporter : 'addTodo' : ba6c894e6774d02d78fe2d48acbdfcc6 72cba2d03eab76a8 INTERNAL [tracer: io.novatec.todobackend.TodobackendApplication:0.1.0] {}This shows that it actually works, however the output is still a bit cryptic.
Let’s inspect this from a Java perspective, by writing the state of the object to standard out.
Add the following log statement between the span.end() call and the return statement:
		span.end();
		logger.info("Span.toString():"+span.toString());

		return todo;
	}
Stop, rebuild and restart the application:
mvn spring-boot:run Switch to your other terminal and use the following command to send a request to the / endpoint:
curl -XPOST localhost:8080/todos/NEW; echoBelow the logging statement from the LoggingExporter you should now see more descriptive details:
2024-07-21T13:05:27.650Z  INFO 23816 --- [springboot-backend ] [nio-8080-exec-1] i.o.e.logging.LoggingSpanExporter        : 'addTodo' : 49fa6e942dd137fdc11ef1178f938078 eeda77d2bfd15a0c INTERNAL [tracer: io.novatec.todobackend.TodobackendApplication:0.1.0] {}
2024-07-21T13:05:27.651Z  INFO 23816 --- [springboot-backend ] [nio-8080-exec-1] i.n.todobackend.TodobackendApplication   : Span.toString():SdkSpan{traceId=49fa6e942dd137fdc11ef1178f938078, spanId=eeda77d2bfd15a0c, parentSpanContext=ImmutableSpanContext{traceId=00000000000000000000000000000000, spanId=0000000000000000, traceFlags=00, traceState=ArrayBasedTraceState{entries=[]}, remote=false, valid=false}, name=addTodo, kind=INTERNAL, attributes=null, status=ImmutableStatusData{statusCode=UNSET, description=}, totalRecordedEvents=0, totalRecordedLinks=0, startEpochNanos=1721567127643127423, endEpochNanos=1721567127650834923}
A span in OpenTelemetry represents a single operation within a trace and carries a wealth of information that provides insight into the operation’s execution. This includes the name of the span, which is a human-readable string that describes the operation. The trace context, consisting of the traceId, spadId, and traceState, uniquely identifies the span within the trace and carries system-specific configuration data. The SpanKind indicates the role of the span, such as whether it’s an internal operation, a server-side operation, or a client-side operation. If the parentId is null, it signifies that the span is the root of a new trace. The startEpochNanos and endEpochNanos timestamps mark the beginning and end of the span’s duration. Additionally, spans can contain attributes that provide further context, such as HTTP methods or response status codes.
Other fields like events, links, and status offer additional details about the span’s lifecycle, outcome and context.
This is also tells us a bit more about the output of the LoggingSpanExporter:
2024-07-21T13:05:27.650Z INFO 23816 --- [springboot-backend ] [nio-8080-exec-1] i.o.e.logging.LoggingSpanExporter : 'addTodo' : 49fa6e942dd137fdc11ef1178f938078 eeda77d2bfd15a0c INTERNAL [tracer: io.novatec.todobackend.TodobackendApplication:0.1.0] {}The first identifier is the traceId, the second one is spandId followed by SpanKind.
Enrich spans with context
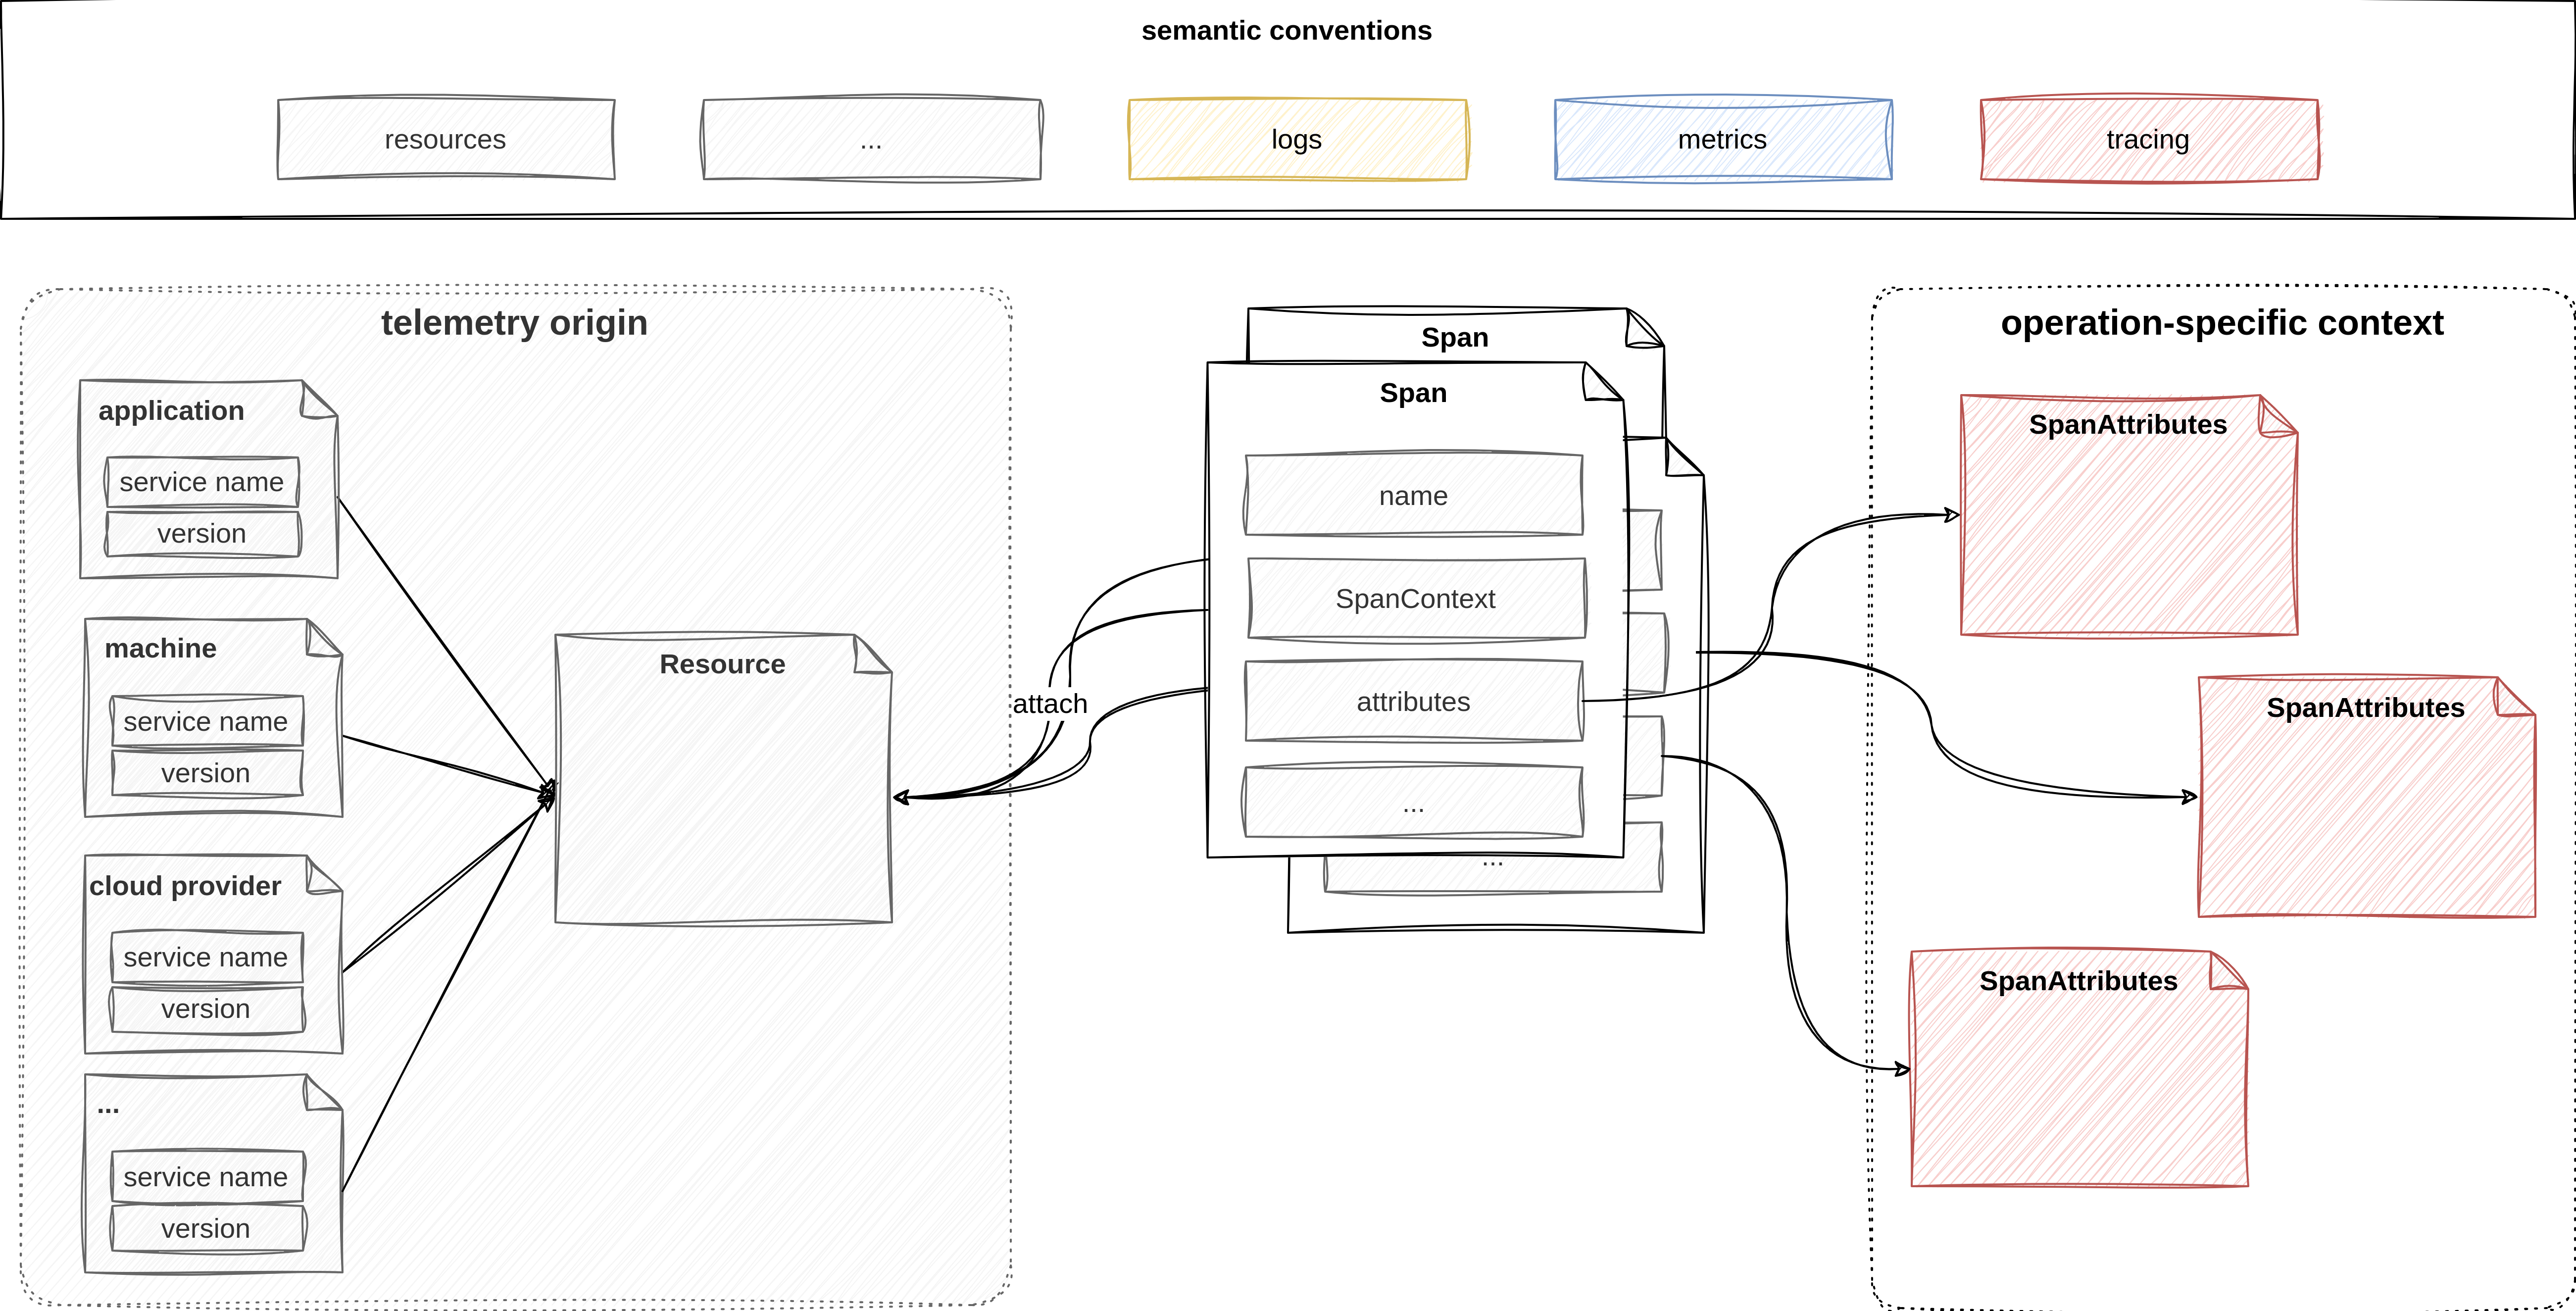
enriching spans with resources and attributes
So far, the contents of the span were automatically generated by the SDK. This information is enough to reason about the chain of events in a transaction and allows us to measure latency. However, it’s important to understand that tracing is a much more potent tool. By enriching spans with additional context, traces can provide meaningful insights about what is happening in a system.
Be aware: Once span.end() has been called, the span is no longer editable. Thus, you always have to enrich the span with
context before finishing it.
Let’s specify the Span kind and set some resource attributes:
Add the setSpanKind invocation to the call, which initializes the new span. And specify two attributes:
		Span span = tracer.spanBuilder("addTodo").setSpanKind(SpanKind.SERVER).startSpan();

		span.setAttribute("http.request.method", "POST");
		span.setAttribute("http.url", "/todos/{todo}");
Stop, rebuild and restart the application:
mvn spring-boot:run Switch to your other terminal and use the following command to send a request to the / endpoint:
curl -XPOST localhost:8080/todos/NEW; echoThe resulting output will look like:
2024-07-24T09:22:07.460Z  INFO 7977 --- [springboot-backend ] [nio-8080-exec-1] i.o.e.logging.LoggingSpanExporter        : 'addTodo' : f150c6404cf8c58398d94bbecb094fdb cd93535232b8d8ca SERVER [tracer: io.novatec.todobackend.TodobackendApplication:0.1.0] AttributesMap{data={http.url=/todos/{todo}, http.method=POST}, capacity=128, totalAddedValues=2}
2024-07-24T09:22:07.461Z  INFO 7977 --- [springboot-backend ] [nio-8080-exec-1] i.n.todobackend.TodobackendApplication   : Span.toString():SdkSpan{traceId=f150c6404cf8c58398d94bbecb094fdb, spanId=cd93535232b8d8ca, parentSpanContext=ImmutableSpanContext{traceId=00000000000000000000000000000000, spanId=0000000000000000, traceFlags=00, traceState=ArrayBasedTraceState{entries=[]}, remote=false, valid=false}, name=addTodo, kind=SERVER, attributes=AttributesMap{data={http.url=/todos/{todo}, http.method=POST}, capacity=128, totalAddedValues=2}, status=ImmutableStatusData{statusCode=UNSET, description=}, totalRecordedEvents=0, totalRecordedLinks=0, startEpochNanos=1721812927453408887, endEpochNanos=1721812927460726137}
In this case all span attribute values have been hardcoded. Of course you can also assign values that you retrieve through a Java API directly.
Let’s get some details from the HttpServletRequest object.
Modify the entire method to look like this:
	@PostMapping("/todos/{todo}")
	String addTodo(HttpServletRequest request, HttpServletResponse response, @PathVariable String todo){

		Span span = tracer.spanBuilder("addTodo").setSpanKind(SpanKind.SERVER).startSpan();

		span.setAttribute("http.request.method", request.getMethod());
		span.setAttribute("http.url", request.getRequestURL().toString());
		span.setAttribute("client.address", request.getRemoteAddr());
		span.setAttribute("user.agent",request.getHeader("User-Agent"));

		this.someInternalMethod(todo);
		logger.info("POST /todos/ "+todo.toString());

		response.setStatus(HttpServletResponse.SC_CREATED);

		span.setAttribute("response.status", HttpServletResponse.SC_CREATED);

		span.end();
		logger.info("Span.toString():"+span.toString());

		return todo;
	}
Restart the app and repeat the curl call.
The resulting output will look like:
2024-07-21T13:46:08.336Z  INFO 43453 --- [springboot-backend ] [nio-8080-exec-1] i.o.e.logging.LoggingSpanExporter        : 'addTodo' : 21d97f2813576a1a2942457e9f0c671b 7474ed21e4081af8 SERVER [tracer: io.novatec.todobackend.TodobackendApplication:0.1.0] AttributesMap{data={client.address=127.0.0.1, user.agent=curl/7.81.0, http.url=http://localhost:8080/todos/NEW, response.status=201, http.method=POST}, capacity=128, totalAddedValues=5}
2024-07-21T13:46:08.336Z  INFO 43453 --- [springboot-backend ] [nio-8080-exec-1] i.n.todobackend.TodobackendApplication   : Span.toString():SdkSpan{traceId=21d97f2813576a1a2942457e9f0c671b, spanId=7474ed21e4081af8, parentSpanContext=ImmutableSpanContext{traceId=00000000000000000000000000000000, spanId=0000000000000000, traceFlags=00, traceState=ArrayBasedTraceState{entries=[]}, remote=false, valid=false}, name=addTodo, kind=SERVER, attributes=AttributesMap{data={client.address=127.0.0.1, user.agent=curl/7.81.0, http.url=http://localhost:8080/todos/NEW, response.status=201, http.method=POST}, capacity=128, totalAddedValues=5}, status=ImmutableStatusData{statusCode=UNSET, description=}, totalRecordedEvents=0, totalRecordedLinks=0, startEpochNanos=1721569568329729512, endEpochNanos=1721569568336094221}
The trace will now contain attributes from the Servlet request and also details from the response, that have been set throughout the invocation of this method.
Nested spans
So far the manual instrumentation has all been taking place within the method addTodo. Even though this method invokes another method someInternalMethod nothing of that behaviour is being captured by the current isntrumentation.
Let’s change that and put 3 statements into your code, 2 for the spans and one additional log.
	String someInternalMethod(String todo){

		Span childSpan = tracer.spanBuilder("someInternalMethod").setSpanKind(SpanKind.INTERNAL).startSpan();

        // ...

		logger.info("childSpan.toString():"+childSpan.toString());
		childSpan.end();
		return todo;
	}
Again, restart the app and repeat the curl call.
You will now get information from two different spans in your log:
2024-07-21T14:25:21.369Z  INFO 43453 --- [springboot-backend ] [nio-8080-exec-1] i.n.todobackend.TodobackendApplication   : childSpan.toString():SdkSpan{traceId=4824ee335e161b729416d1c3728da0d0, spanId=673a995310fa21b2, parentSpanContext=ImmutableSpanContext{traceId=00000000000000000000000000000000, spanId=0000000000000000, traceFlags=00, traceState=ArrayBasedTraceState{entries=[]}, remote=false, valid=false}, name=someInternalMethod, kind=INTERNAL, attributes=null, status=ImmutableStatusData{statusCode=UNSET, description=}, totalRecordedEvents=0, totalRecordedLinks=0, startEpochNanos=1721571921364073673, endEpochNanos=0}

...

2024-07-21T14:25:21.370Z  INFO 43453 --- [springboot-backend ] [nio-8080-exec-1] i.n.todobackend.TodobackendApplication   : Span.toString():SdkSpan{traceId=2551e1c45eeb37c9ab1bd7a016fa5833, spanId=c955fbcc8f45d28e, parentSpanContext=ImmutableSpanContext{traceId=00000000000000000000000000000000, spanId=0000000000000000, traceFlags=00, traceState=ArrayBasedTraceState{entries=[]}, remote=false, valid=false}, name=addTodo, kind=SERVER, attributes=AttributesMap{data={client.address=127.0.0.1, user.agent=curl/7.81.0, http.url=http://localhost:8080/todos/NEW, response.status=201, http.method=POST}, capacity=128, totalAddedValues=5}, status=ImmutableStatusData{statusCode=UNSET, description=}, totalRecordedEvents=0, totalRecordedLinks=0, startEpochNanos=1721571921363715964, endEpochNanos=1721571921370347506}
The interesting part in both spans is the following part:
parentSpanContext=ImmutableSpanContext{traceId=00000000000000000000000000000000, spanId=0000000000000000The parent span will always be null with a new call.
However, here we have a relation between the two calls, so it is surprising that the child span
(or let’s say the one we know is the child span) has this setting as well.
So from the perspective of OpenTelemetry these are two totally independent spans.
We need to use the OpenTelemetry context scope. Embed the call to the child method someInternalMethod with
the following block:
		try (Scope scope = span.makeCurrent()) {
            this.someInternalMethod(todo);
            response.setStatus(HttpServletResponse.SC_CREATED);
			span.setAttribute("response.status", HttpServletResponse.SC_CREATED);
		} finally {
            span.end();
		}

        logger.info("POST /todos/ "+todo.toString());
        logger.info("Span.toString():"+span.toString());

        return todo;
	}
Build, run and curl again.
2024-07-21T15:11:10.327Z  INFO 43453 --- [springboot-backend ] [nio-8080-exec-1] i.n.todobackend.TodobackendApplication   : childSpan.toString():SdkSpan{traceId=4c561f212ee8a152663f960490dac269, spanId=aa5935fc54da79da, parentSpanContext=ImmutableSpanContext{traceId=4c561f212ee8a152663f960490dac269, spanId=c630f6e5a0cde90c, traceFlags=01, traceState=ArrayBasedTraceState{entries=[]}, remote=false, valid=true}, name=someInternalMethod, kind=INTERNAL, attributes=null, status=ImmutableStatusData{statusCode=UNSET, description=}, totalRecordedEvents=0, totalRecordedLinks=0, startEpochNanos=1721574670304760501, endEpochNanos=0}
``

2024-07-21T15:11:10.327Z  INFO 43453 --- [springboot-backend ] [nio-8080-exec-1] i.n.todobackend.TodobackendApplication   : Span.toString():SdkSpan{traceId=4c561f212ee8a152663f960490dac269, spanId=c630f6e5a0cde90c, parentSpanContext=ImmutableSpanContext{traceId=00000000000000000000000000000000, spanId=0000000000000000, traceFlags=00, traceState=ArrayBasedTraceState{entries=[]}, remote=false, valid=false}, name=addTodo, kind=SERVER, attributes=AttributesMap{data={client.address=127.0.0.1, user.agent=curl/7.81.0, http.url=http://localhost:8080/todos/NEW, http.method=POST}, capacity=128, totalAddedValues=4}, status=ImmutableStatusData{statusCode=UNSET, description=}, totalRecordedEvents=0, totalRecordedLinks=0, startEpochNanos=1721574670300677293, endEpochNanos=1721574670327453585}
If you look at the someInternalMethod span first and focus on the parent span context, you will see:
parentSpanContext=ImmutableSpanContext{traceId=4c561f212ee8a152663f960490dac269, spanId=c630f6e5a0cde90cwhich is exactly the trace and span id of the addTodo method.
The OpenTelemetry API offers also an automated way to propagate the parent span to child spans. This works however only, if they run within the same thread.
Handling an error
The someInternalMethod can simulate an error behaviour and throw an exception, if somebody uses the todo with name fail.
		if(todo.equals("fail")){

			System.out.println("Failing ...");
			throw new RuntimeException();

		}
We can catch this exception in the addTodo method.
Extend the try{} block we created in the previous step with the following code:
		try (Scope scope = span.makeCurrent()) {
			this.someInternalMethod(todo);
			response.setStatus(HttpServletResponse.SC_CREATED);
			span.setAttribute("response.status", HttpServletResponse.SC_CREATED);
		} catch (Throwable t) {
			span.setStatus(StatusCode.ERROR, "Error on server side!");
			span.recordException(t);
			response.setStatus(HttpServletResponse.SC_INTERNAL_SERVER_ERROR);
			span.setAttribute("response.status", HttpServletResponse.SC_INTERNAL_SERVER_ERROR);
		} finally {
			span.end();
		}
Restart the app.
This time execute the curl call with the todo triggering a failure.
curl -XPOST localhost:8080/todos/fail; echoIf you look at the output log now, you can see the error status in the parent span.
2024-07-21T16:01:27.683Z INFO 70461 --- [springboot-backend ] [nio-8080-exec-1] i.n.todobackend.TodobackendApplication : Span.toString():SdkSpan{traceId=29b65aa14526263d1a74c117dbbf7ea8, spanId=6296d1d4ba880147, parentSpanContext=ImmutableSpanContext{traceId=00000000000000000000000000000000, spanId=0000000000000000, traceFlags=00, traceState=ArrayBasedTraceState{entries=[]}, remote=false, valid=false}, name=addTodo, kind=SERVER, attributes=AttributesMap{data={http.method=POST, http.url=http://localhost:8080/todos/fail, client.address=127.0.0.1, user.agent=curl/7.81.0, response.status=500}, capacity=128, totalAddedValues=5}, status=ImmutableStatusData{statusCode=ERROR, description=Error on server side!}, totalRecordedEvents=1, totalRecordedLinks=0, startEpochNanos=1721577687675216250, endEpochNanos=1721577687683172166}Adding events
Normally, if some metadata is relevant for the entire duration of a span, you will add the data as attributes.
For instance, which http.request.method was used or which client.address has sent a request.
However, sometimes you also want to record time-specific scenarios within your span.
Since attributes do not provide a timestamp, in that case you should use span events instead.
Actually, you have already added a span event in the previous snippet via span.recordException(t).
Exceptions are just a special type of span event. Of course you can add events of all types.
Additionally, events can also be enriched with their own attributes.
These attributes will only appear within the recorded event.
Modify the addTodo method to add another event, whenever the path variable was validated,
as shown below. The method isValid already exists.
        Span span = tracer.spanBuilder("addTodo").setSpanKind(SpanKind.SERVER).startSpan();

        boolean valid = this.isValid(todo);
		span.addEvent("todo validated", Attributes.of(booleanKey("valid"), valid));

        //...
Restart the app and repeat the curl call.
Take a look at the value of totalRecordedEvents in the output log of the span.
Semantic conventions
There are only two hard things in Computer Science: cache invalidation and naming things. – Phil Karlton
Consistency is a hallmark of high-quality telemetry.
Looking at the current code, nothing prevents a developer from using arbitrary keys for attributes
(e.g. method instead of http.request.method).
While human intuition allows us to conclude that both refer to the same thing, machines are (luckily) not that smart.
Inconsistencies in the definition of telemetry make it harder to analyze the data down the line.
This is why OpenTelemetry’s specification includes semantic conventions.
This standardization effort helps to improve consistency, prevents us from making typos, and avoids ambiguity due to
differences in spelling.
OpenTelemetry provides a Java dependency io.opentelemetry.semconv:opentelemetry-semconv that we have already
included earlier.
Let’s refactor our code. First you have to import the following classes:
        import io.opentelemetry.semconv.ClientAttributes;
        import io.opentelemetry.semconv.HttpAttributes;
        import io.opentelemetry.semconv.UserAgentAttributes;
Then use the imported classes for the attributes keys:
        // ...
        span.setAttribute(HttpAttributes.HTTP_REQUEST_METHOD, request.getMethod());
        span.setAttribute(HttpAttributes.HTTP_ROUTE, request.getRequestURL().toString());
        span.setAttribute(ClientAttributes.CLIENT_ADDRESS, request.getRemoteAddr());
        span.setAttribute(UserAgentAttributes.USER_AGENT_ORIGINAL, request.getHeader("User-Agent"));
        // ...
        span.setAttribute(HttpAttributes.HTTP_RESPONSE_STATUS_CODE, HttpServletResponse.SC_CREATED);
        // ...
        span.setAttribute(HttpAttributes.HTTP_RESPONSE_STATUS_CODE, HttpServletResponse.SC_INTERNAL_SERVER_ERROR);
        // ...
Explore the documentation to look for a convention that matches the
metadata we want to record.
The specification defines conventions for various aspects of a telemetry system (e.g. different telemetry signals,
runtime environments, etc.).
Due to the challenges of standardization and OpenTelemetry’s strong commitment to long-term API stability,
many conventions are still marked as experimental.
For now, we’ll use this as an example.
Instead of specifying the attributes keys (and sometimes values) by typing their string by hand, we reference
objects provided by OpenTelemetry’s opentelemetry-semconv dependency.
You may restart the app and repeat the curl call to view the attribute names.
Continue an existing trace
Let’s switch perspective. Imagine that our Java application is a remote service that we send a request to. In this scenario, the service must recognize that the incoming request is part of an ongoing trace. We want to keep the trace continuing in our service.
Use the curl command to send a request with a fictional tracing header to the application.
curl -XPOST "localhost:8080/todos/NEW" --header "traceparent: 00-aaaaaaaaaaaaaaaaaaaaaaaaaaaaaaaa-00ffffffffffffff-01"If you look at the output, you will notice that the tracer generated a span with a random traceId and
no spanId in the parentSpanContext.
But this is not the behaviour what we want!
Apparently, the local context doesn’t include information about the traceparent header in inbound requests.
OpenTelemetry provides ContextPropagators to solve this issue. Basically, they help you to inject data into
a Context from various sources or extract data from a Context for further use.
You can register multiple ContextPropagators at once, but for new we only will use the W3CTraceContextPropagator,
which propagates the trace context using the W3C propagation protocol.
To use this propagator, several steps are required. First, import these classes in your OpenTelemetry configuration:
      //Propagation
      import io.opentelemetry.api.trace.propagation.W3CTraceContextPropagator;
      import io.opentelemetry.context.propagation.ContextPropagators;
Then, set the propagators in the OpenTelemetry SDK. As mention previously, we use the W3CTraceContextPropagator to
extract the trace context from HTTP headers.
        //...
        ContextPropagators contextPropagators = ContextPropagators.create(W3CTraceContextPropagator.getInstance());

        OpenTelemetry openTelemetry = OpenTelemetrySdk.builder()
                .setTracerProvider(sdkTracerProvider)
                .setPropagators(contextPropagators)
                .build();

		return openTelemetry;
We switch to the application. Add the following imports:
        import io.opentelemetry.context.Context;
        import io.opentelemetry.context.propagation.ContextPropagators;
        import io.opentelemetry.context.propagation.TextMapGetter;
And again, create a global variable, which will be initialized in the existing constructor.
        private ContextPropagators contextPropagators;

        public TodobackendApplication(OpenTelemetry openTelemetry) {

            this.tracer = openTelemetry.getTracer(TodobackendApplication.class.getName(), "0.1.0");
            this.contextPropagators = openTelemetry.getPropagators();
        }
To extract data from HTTP requests, we will need to implement a new TextMapGetter. This class should contain the
logic, how we can read the data provided by a HttpServletRequest. Add this new class at the bottom of
TodobackendApplication.java or create a new java file in the same folder.
        class HttpRequestGetter implements TextMapGetter<HttpServletRequest> {

            @Override
            public Iterable<String> keys(HttpServletRequest carrier) {
                return Collections.list(carrier.getHeaderNames());
            }

            @Override
            public String get(HttpServletRequest carrier, String key) {
                return carrier.getHeader(key);
            }
        }
Make sure this class is imported, where the TextMapGetter is implemented:
import java.util.Collections;Now, we are ready to edit the addTodo method. Before starting a new span, we need to provide a
parent context to allow propagation. To create such parent context, we will use the ContextPropagators to extract
data from the HttpServletRequest. The propagator requires a Context object, which will be used to store the
extracted data, some carrier object, which holds the data and the previously mentioned TextMapGetter, which contains
the logic to extract the data from the carrier. If no data could be extracted from the carrier, the parent context
will be the same as the provided Context object.
As shown below, extract the traceparent from the request and use the created context as parent for the new span:
      @PostMapping("/todos/{todo}")
      String addTodo(HttpServletRequest request, HttpServletResponse response, @PathVariable String todo) {

          // Extract data to create parent context
          Context parentContext = contextPropagators.getTextMapPropagator()
                  .extract(Context.current(), request, new HttpRequestGetter());

          Span span = tracer.spanBuilder("addTodo")
                  .setParent(parentContext) // use parent context for span
                  .setSpanKind(SpanKind.SERVER)
                  .startSpan();

          //...
      }
Restart the app once again and send a request via:
curl -XPOST "localhost:8080/todos/NEW" --header "traceparent: 00-aaaaaaaaaaaaaaaaaaaaaaaaaaaaaaaa-00ffffffffffffff-01"The spans of the application should all use the traceId from the header. Additionally, the span of the addTodo will
use the spanId from the header in the parentSpanContext.
Analogous to this, it is also possible to inject the current context into an outgoing request to further
propagate it to other services. Instead of the extract method, you will need to use the inject method of the
ContextPropagators. Furthermore, you will have to implement a TextMapSetter, which will contain the logic,
how to write data in the outgoing request.
Exporting traces via OTLP
So far everything we collected as tracing information has been processed by the pipeline we defined in
the OpenTelemetryConfiguration class.
This configures the pipeline to use SimpleSpanProcessor in combination with LoggingSpanExporter.
This time we want to export in OTLP format to a gRPC receiving endpoint. The OtlpGrpcSpanExporter can help us here.
Modify the beginning of the class to the code shown below:
	public OpenTelemetry openTelemetry() {

		Resource resource = Resource.getDefault().toBuilder()
                .put(ResourceAttributes.SERVICE_NAME, "todobackend")
                .put(ResourceAttributes.SERVICE_VERSION, "0.1.0")
                .build();

		OtlpGrpcSpanExporter jaegerOtlpExporter =
        OtlpGrpcSpanExporter.builder()
            .setEndpoint("http://localhost:4317")
            .setTimeout(30, TimeUnit.SECONDS)
            .build();

		SdkTracerProvider sdkTracerProvider = SdkTracerProvider.builder()
			.addSpanProcessor(SimpleSpanProcessor.create(LoggingSpanExporter.create()))
			.addSpanProcessor(SimpleSpanProcessor.create(jaegerOtlpExporter))
			.setResource(resource)
			.build();

        // ...
Also make sure the following imports exist:
import io.opentelemetry.exporter.otlp.trace.OtlpGrpcSpanExporter;
import java.util.concurrent.TimeUnit;
As you can see we created an instance of OtlpGrpcSpanExporter called jaegerOtlpExporter and configured it to send
the data to http://localhost:4317.
In the Tracer Provider we just added another addSpanProcessor call to the already existing one. OpenTelemetry is
able to handle multiple different and parallel processors.
Rebuild, restart and issue a curl call.
mvn spring-boot:run curl -XPOST localhost:8080/todos/NEW; echoBesides the familiar logging statements, you will see two errors in the logs now:
2024-07-21T16:18:20.179Z  WARN 70461 --- [springboot-backend ] [alhost:4317/...] i.o.exporter.internal.grpc.GrpcExporter  : Failed to export spans. Server responded with gRPC status code 2. Error message: Failed to connect to localhost/[0:0:0:0:0:0:0:1]:4317
2024-07-21T16:18:20.179Z  WARN 70461 --- [springboot-backend ] [alhost:4317/...] i.o.exporter.internal.grpc.GrpcExporter  : Failed to export spans. Server responded with gRPC status code 2. Error message: Failed to connect to localhost/[0:0:0:0:0:0:0:1]:4317
This is because there is nothing listening on http://localhost:4317.
Open another terminal window and start a docker container like this:
docker run -d --name jaeger \
  -e COLLECTOR_OTLP_ENABLED=true \
  -p 16686:16686 \
  -p 4317:4317 \
  jaegertracing/all-in-one
After this container has started, execute a couple of traces and investigate the details in the Jaeger web
console http://localhost:16686