OpenTelemetry in Action
Introduction
This introductory lab exercise will demonstrate capabilities of OpenTelemetry from an end-user perspective. There will be no changes in configuration necessary. It’s simply about starting a set of pre-defined containers and walking through usage scenarios.
The intention is to provide a high-level understanding of how OpenTelemetry works, how it integrates with both application components and observability tools, and to become familiar with a typical setup.
It furthermore provides a lookout to the various chapters of this lab.
Learning Objectives
By the end of this chapter, you should be able to:
- Gain Hands-On access to a pre-configured, OpenTelemetry-enabled application
- Explain the roles of mandatory components
- Use web-based dashboards for Tracing (Jaeger) and Monitoring (Prometheus)
- Interact with the OpenTelemetry-enabled application and observe results in the various dashboard
- Observe slow running and failing components
How to perform the exercise
- This exercise is based on the following repository repository
- All exercises are in the subdirectory
exercises. There is also an environment variable$EXERCISESpointing to this directory. All directories given are relative to this one. - Initial directory:
otel-in-action
Architecture
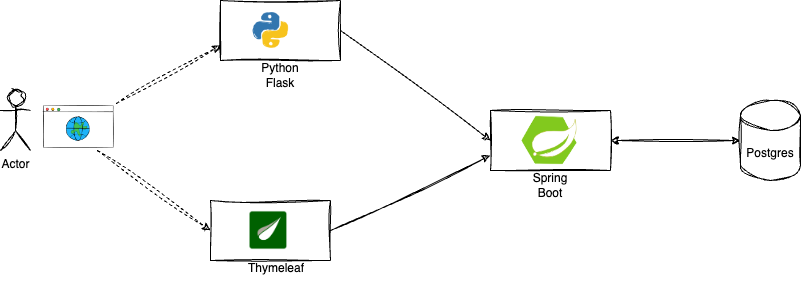
The following diagram explains the architecture:
- there is an simple underlying polylot, multi-service application
- the components are implemented in Java (Spring Boot) and Python (Flask)
- two alternate frontends connect to a backend part, which in turn connects to a Postgres database
- there is a simple load generator, which continuously sends requests to the frontend components
Application Architecture
the application components are already instrumented by an OpenTelemetry agent
all of the collected information is being sent to an OpenTelemetry collector
the OpenTelemetry Collector exports the information to various thirs-party applications
- the (distributed) traces are exported to a Jaeger instance
- the metrics are exported to a Prometheus instance
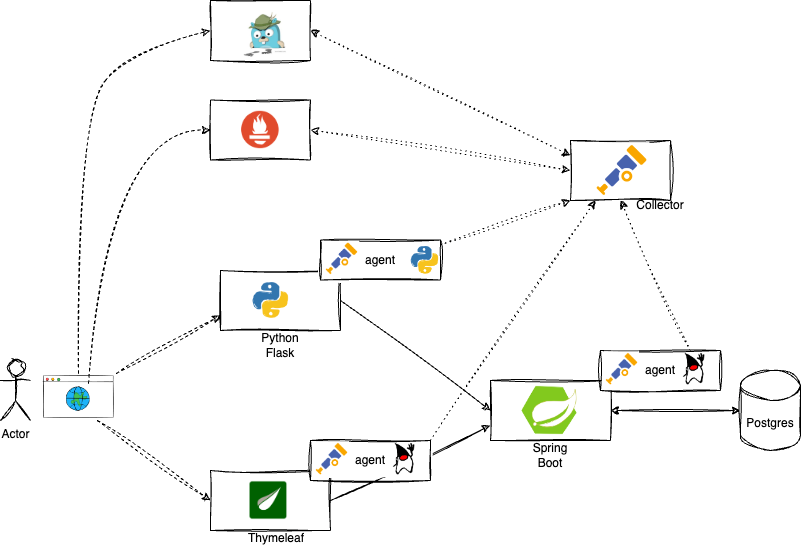
Application Architecture Instrumented
The entire stack of components is modeled in containers and can be run using a docker-compose file.
Demo environment
To access the demo environment, switch to the directory for this exercise:
cd $EXERCISES
cd otel-in-action
Then execute the docker-compose file to build and bring up the containers.
docker compose upThe output should show the startup process of the containers. Afterwards, you should see the standard out and standard error output of the running containers.
The beginning of the output should look similar to this:
[+] Running 8/0
 ✔ Container python-java-otel-todolist-todoui-thymeleaf-1        Created                                                                                     0.0s
 ✔ Container python-java-otel-todolist-postgresdb-1              Created                                                                                     0.0s
 ✔ Container python-java-otel-todolist-loadgenerator-1           Created                                                                                     0.0s
 ✔ Container python-java-otel-todolist-jaeger-1                  Created                                                                                     0.0s
 ✔ Container python-java-otel-todolist-prometheus-1              Created                                                                                     0.0s
 ✔ Container python-java-otel-todolist-todoui-flask-1            Created                                                                                     0.0s
 ✔ Container python-java-otel-todolist-todobackend-springboot-1  Created                                                                                     0.0s
 ✔ Container python-java-otel-todolist-otelcol-1                 Created
As the ongoing output of all components can get very noisy, it is recommended to start a new terminal session and leave the ‘docker compose up’ terminal session running in the background.
It will take up to two minutes on a standard machine until all containers are in a ready state.
Validate the running behavior by executing:
docker psYou should see 8 running containers
Name: python-java-otel-todolist-todobackend-springboot-1		Uptime: 3 minutes ago	Ports: 0.0.0.0:8080->8080/tcp
Name: python-java-otel-todolist-otelcol-1		Uptime: 3 minutes ago	Ports: 0.0.0.0:4317-4318->4317-4318/tcp, 55678-55679/tcp
Name: python-java-otel-todolist-postgresdb-1		Uptime: 3 minutes ago	Ports: 0.0.0.0:5432->5432/tcp
Name: python-java-otel-todolist-todoui-thymeleaf-1		Uptime: 3 minutes ago	Ports: 0.0.0.0:8090->8090/tcp
Name: python-java-otel-todolist-prometheus-1		Uptime: 3 minutes ago	Ports: 0.0.0.0:9090->9090/tcp
Name: python-java-otel-todolist-jaeger-1		Uptime: 3 minutes ago	Ports: 5775/udp, 5778/tcp, 14250/tcp, 6831-6832/udp, 14268/tcp, 0.0.0.0:16686->16686/tcp
Name: python-java-otel-todolist-todoui-flask-1		Uptime: 3 minutes ago	Ports: 0.0.0.0:5001->5000/tcp
Name: python-java-otel-todolist-loadgenerator-1		Uptime: 3 minutes ago	Ports:
Accessing the demo application components
URLs and Ports
As you could see in the results of the docker ps call in the previous exercise most application components expose their service over a certain port.
Via those ports it is possible to access the various exposed UIs.
If you run your application with a local devcontainer environment, you can simply access them via localhost.
Especially the section about ports and hostnames is relevant here.
Open the PORTS tab on the bottom of your IDE and locate the URLs for the web UIs of the Python and Java frontends
- Python/Flask frontend - the service with port 5001
- Java/Thymeleaf frontend - the service with port 8090
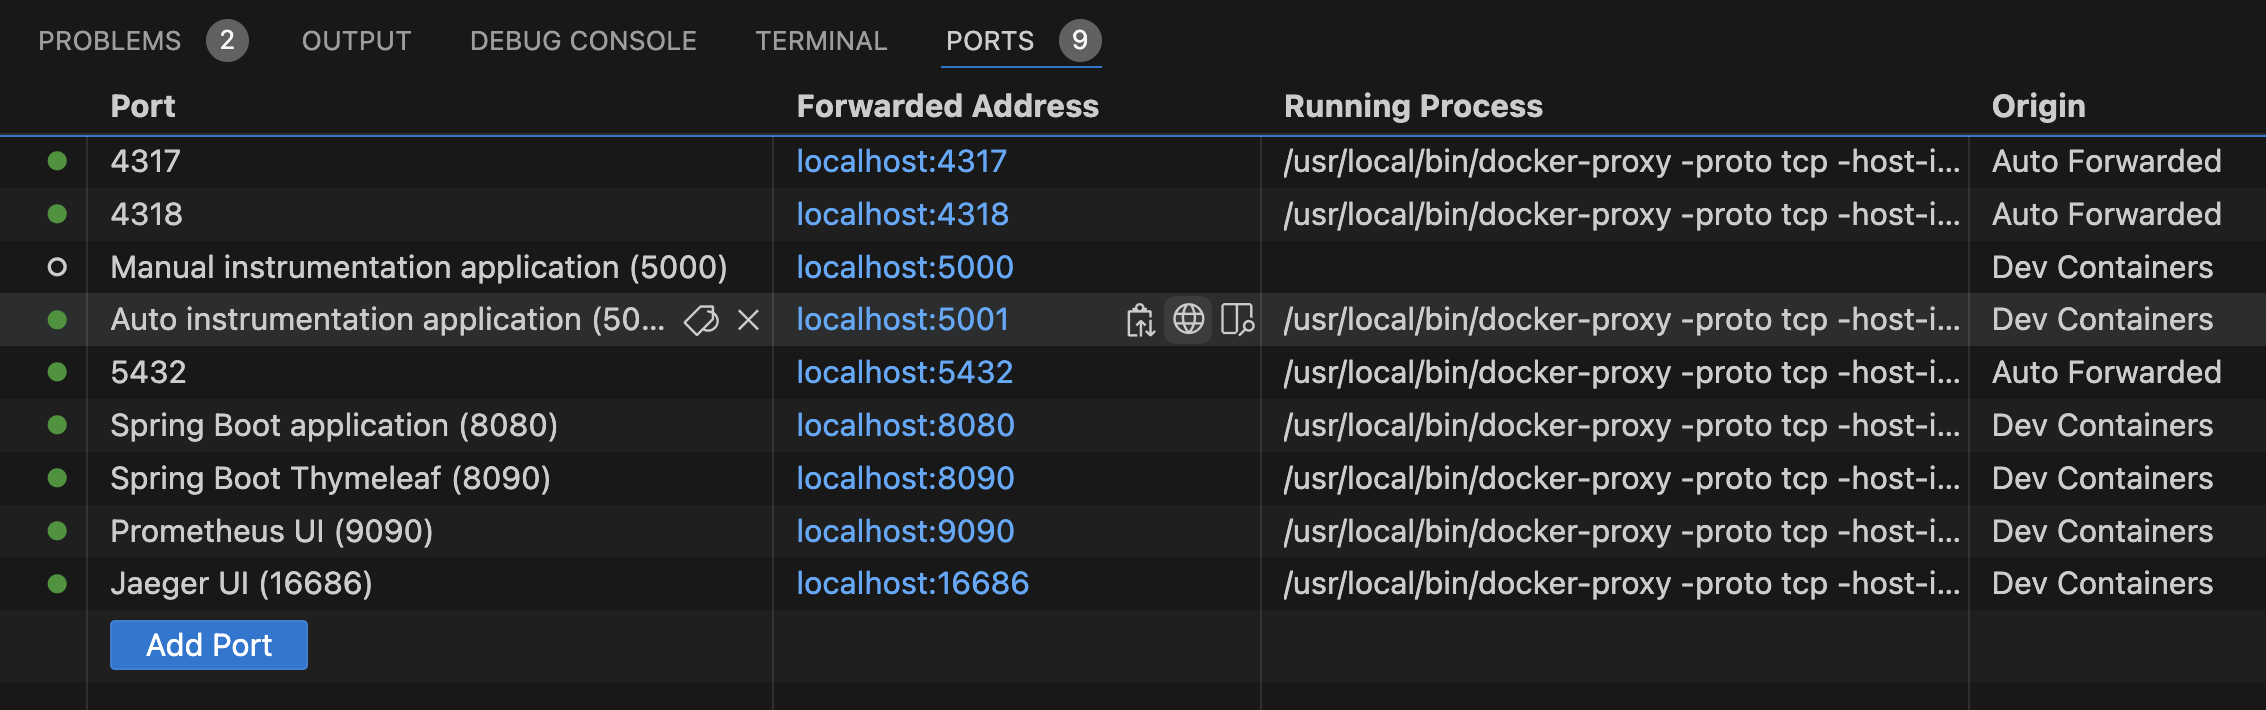
Ports in VS Code
The core part of the application exposes a REST API and can also be accessed via URL. It is the service with port 8080.
However, it’s of course more convenient (and better for showing distributed traces) when invoking the app through the web UIs.
Start by opening the Python frontend in your browser on http://localhost:5001. It will bring up a Web UI looking like this:
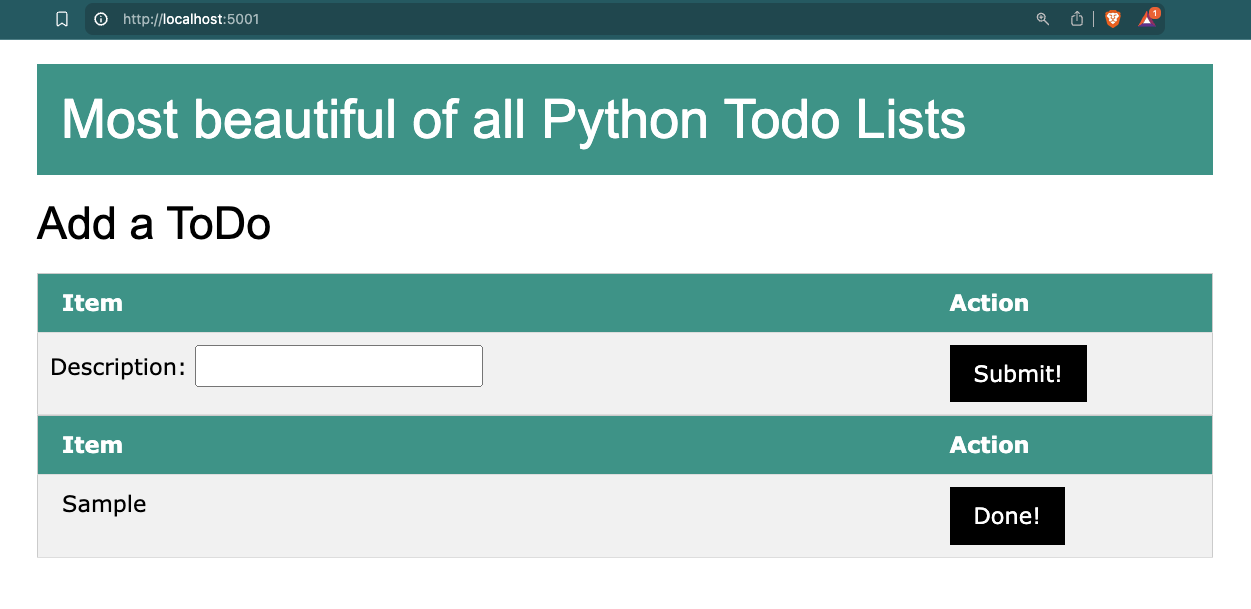
Python Web UI
You can feel free to add some “ToDo” items yourself and/or set some of them done. Most likely you will also see an item called “Sample” come and go. This is being set and removed by the load generator.
Repeat the same steps with the alternate frontend running on http://localhost:8090.
Configuration and data flow
The docker-compose file itself already reveals a lot about the configuration of the components.
If you look into it under the part services, you will see that both Java components and the Python app have an environment property called OTEL_RESOURCE_ATTRIBUTES=service,name and each of them has it set to an own value:
    environment:
- OTEL_RESOURCE_ATTRIBUTES=service.name=todobackend-springboot environment:
- OTEL_RESOURCE_ATTRIBUTES=service.name=frontend-flask environment:
- OTEL_RESOURCE_ATTRIBUTES=service.name=frontend-thymeleafThis is the property how the components identify themself within the OpenTelemetry scope. The name will appear later again in various dashboards.
More details about how to configure application components automatically or manually, see the later chapter “Instrumentation”.
Furthermore there is a property, which they all share:
    environment:
      - OTEL_EXPORTER_OTLP_ENDPOINT=${OTEL_EXPORTER_OTLP_ENDPOINT}
whereas the actual value of this endpoint is specified in an .envfile:
OTEL_COLLECTOR_HOST=otelcol
OTEL_COLLECTOR_PORT_GRPC=4317
OTEL_COLLECTOR_PORT_HTTP=4318
OTEL_EXPORTER_OTLP_ENDPOINT=http://${OTEL_COLLECTOR_HOST}:${OTEL_COLLECTOR_PORT_GRPC}
This shows that all components point to the OpenTelemetry collector and use the listening GRPC port 4317. The chapter “Collector” will provide more details on how to configure the OpenTelemetry collector.
Tracing
Using Jaeger UI
OpenTelemetry allows you to export the tracing information to various third-party applications. A popular Open-Source option is a tool called Jaeger Tracing
The collector in this environment is configured to export the tracing metrics to the Jaeger instance.
You can access the Jaeger web UI at the following link
After opening the link, you will be redirected to the Search page of Jaeger. Initially, there is no trace information displayed. You need to query first.
The page you should be seeing looks like this:
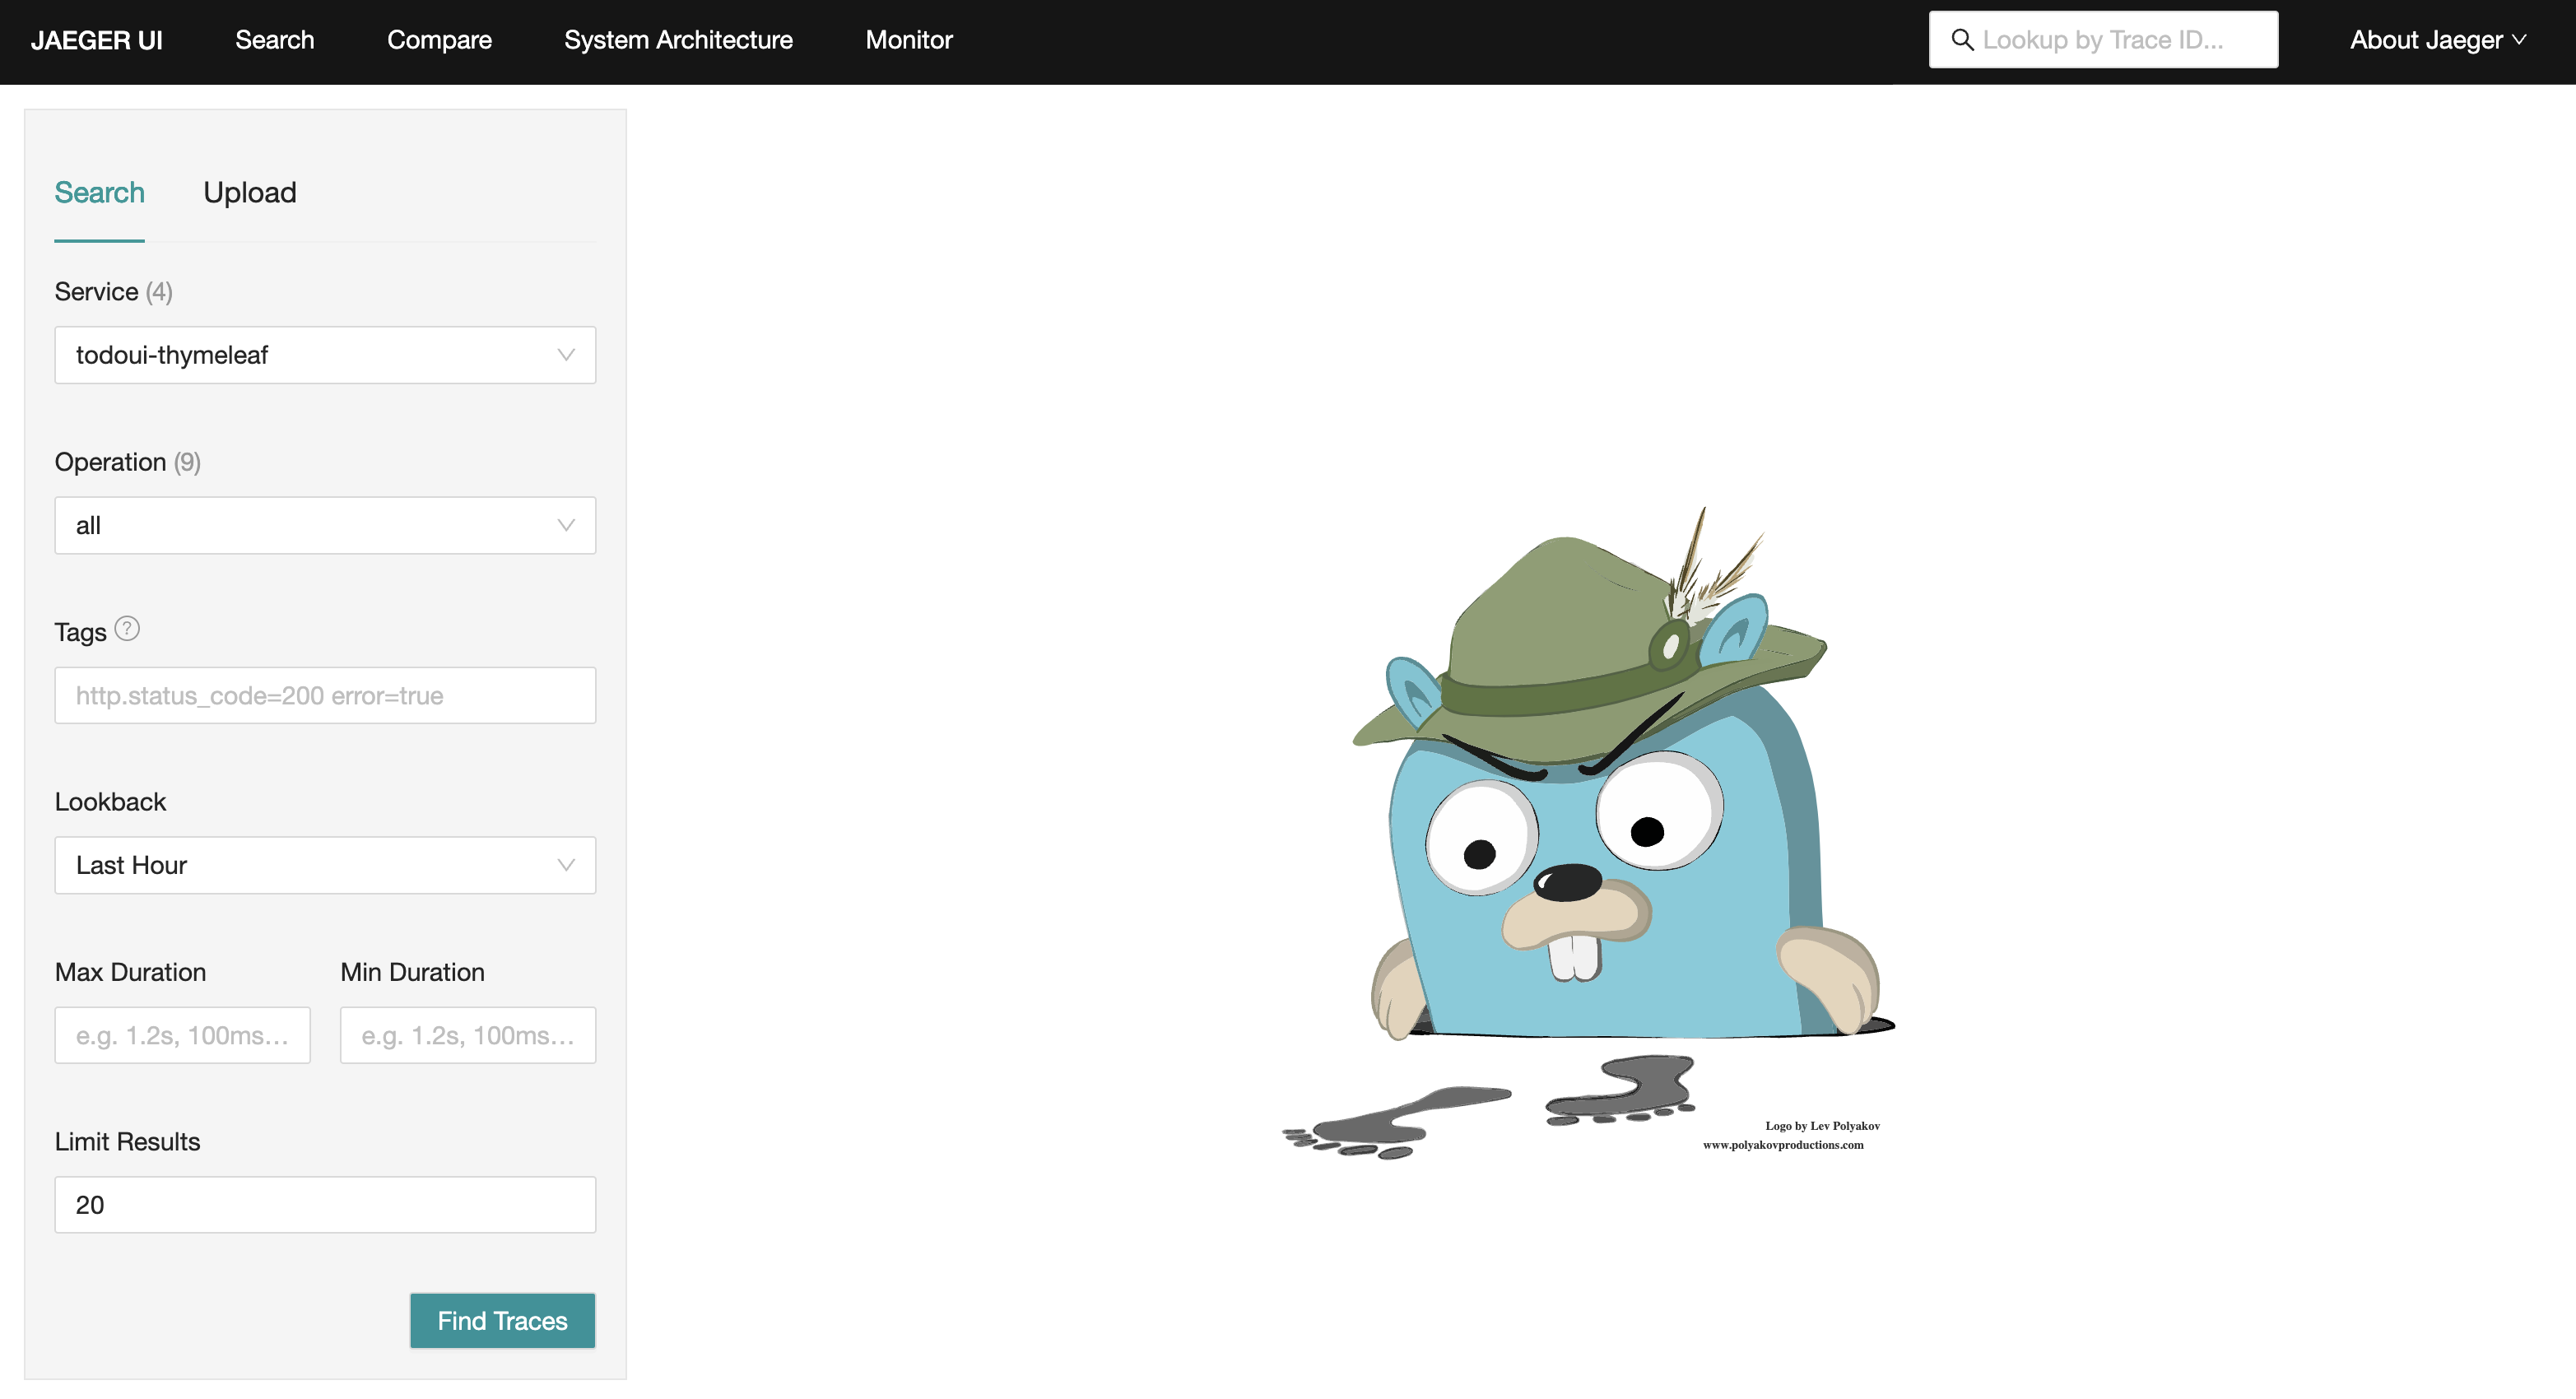
Jaeger main screen
In the top left corner, there is a drop-down list called “Services”. If you expand it, it will show all the services for which Jaeger has tracing information.
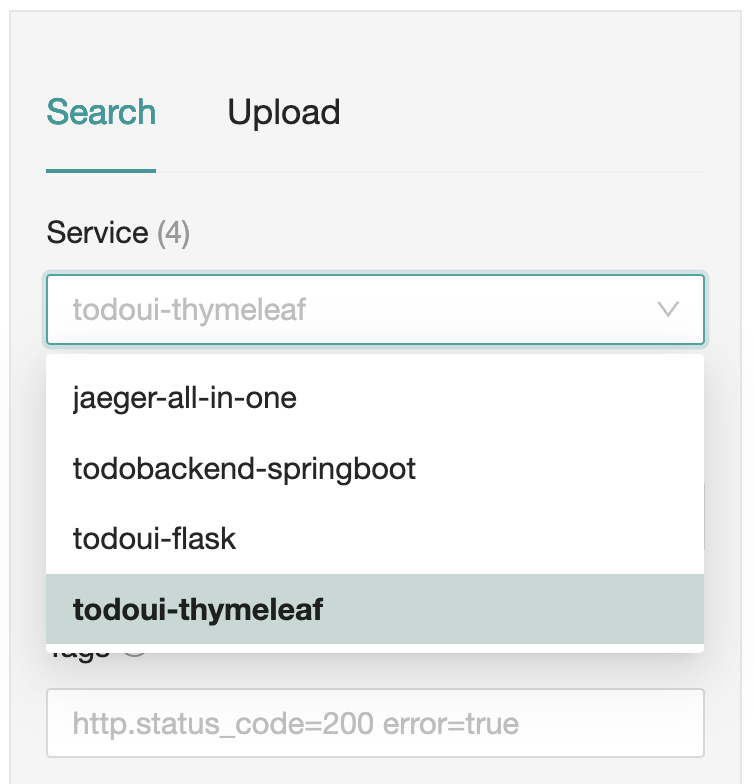
Jaeger services selection
It will show the various services that are currently running in the sample application. Select todobackend-springboot click on Find Traces.
You should now see a page where recently collected traces are listed.
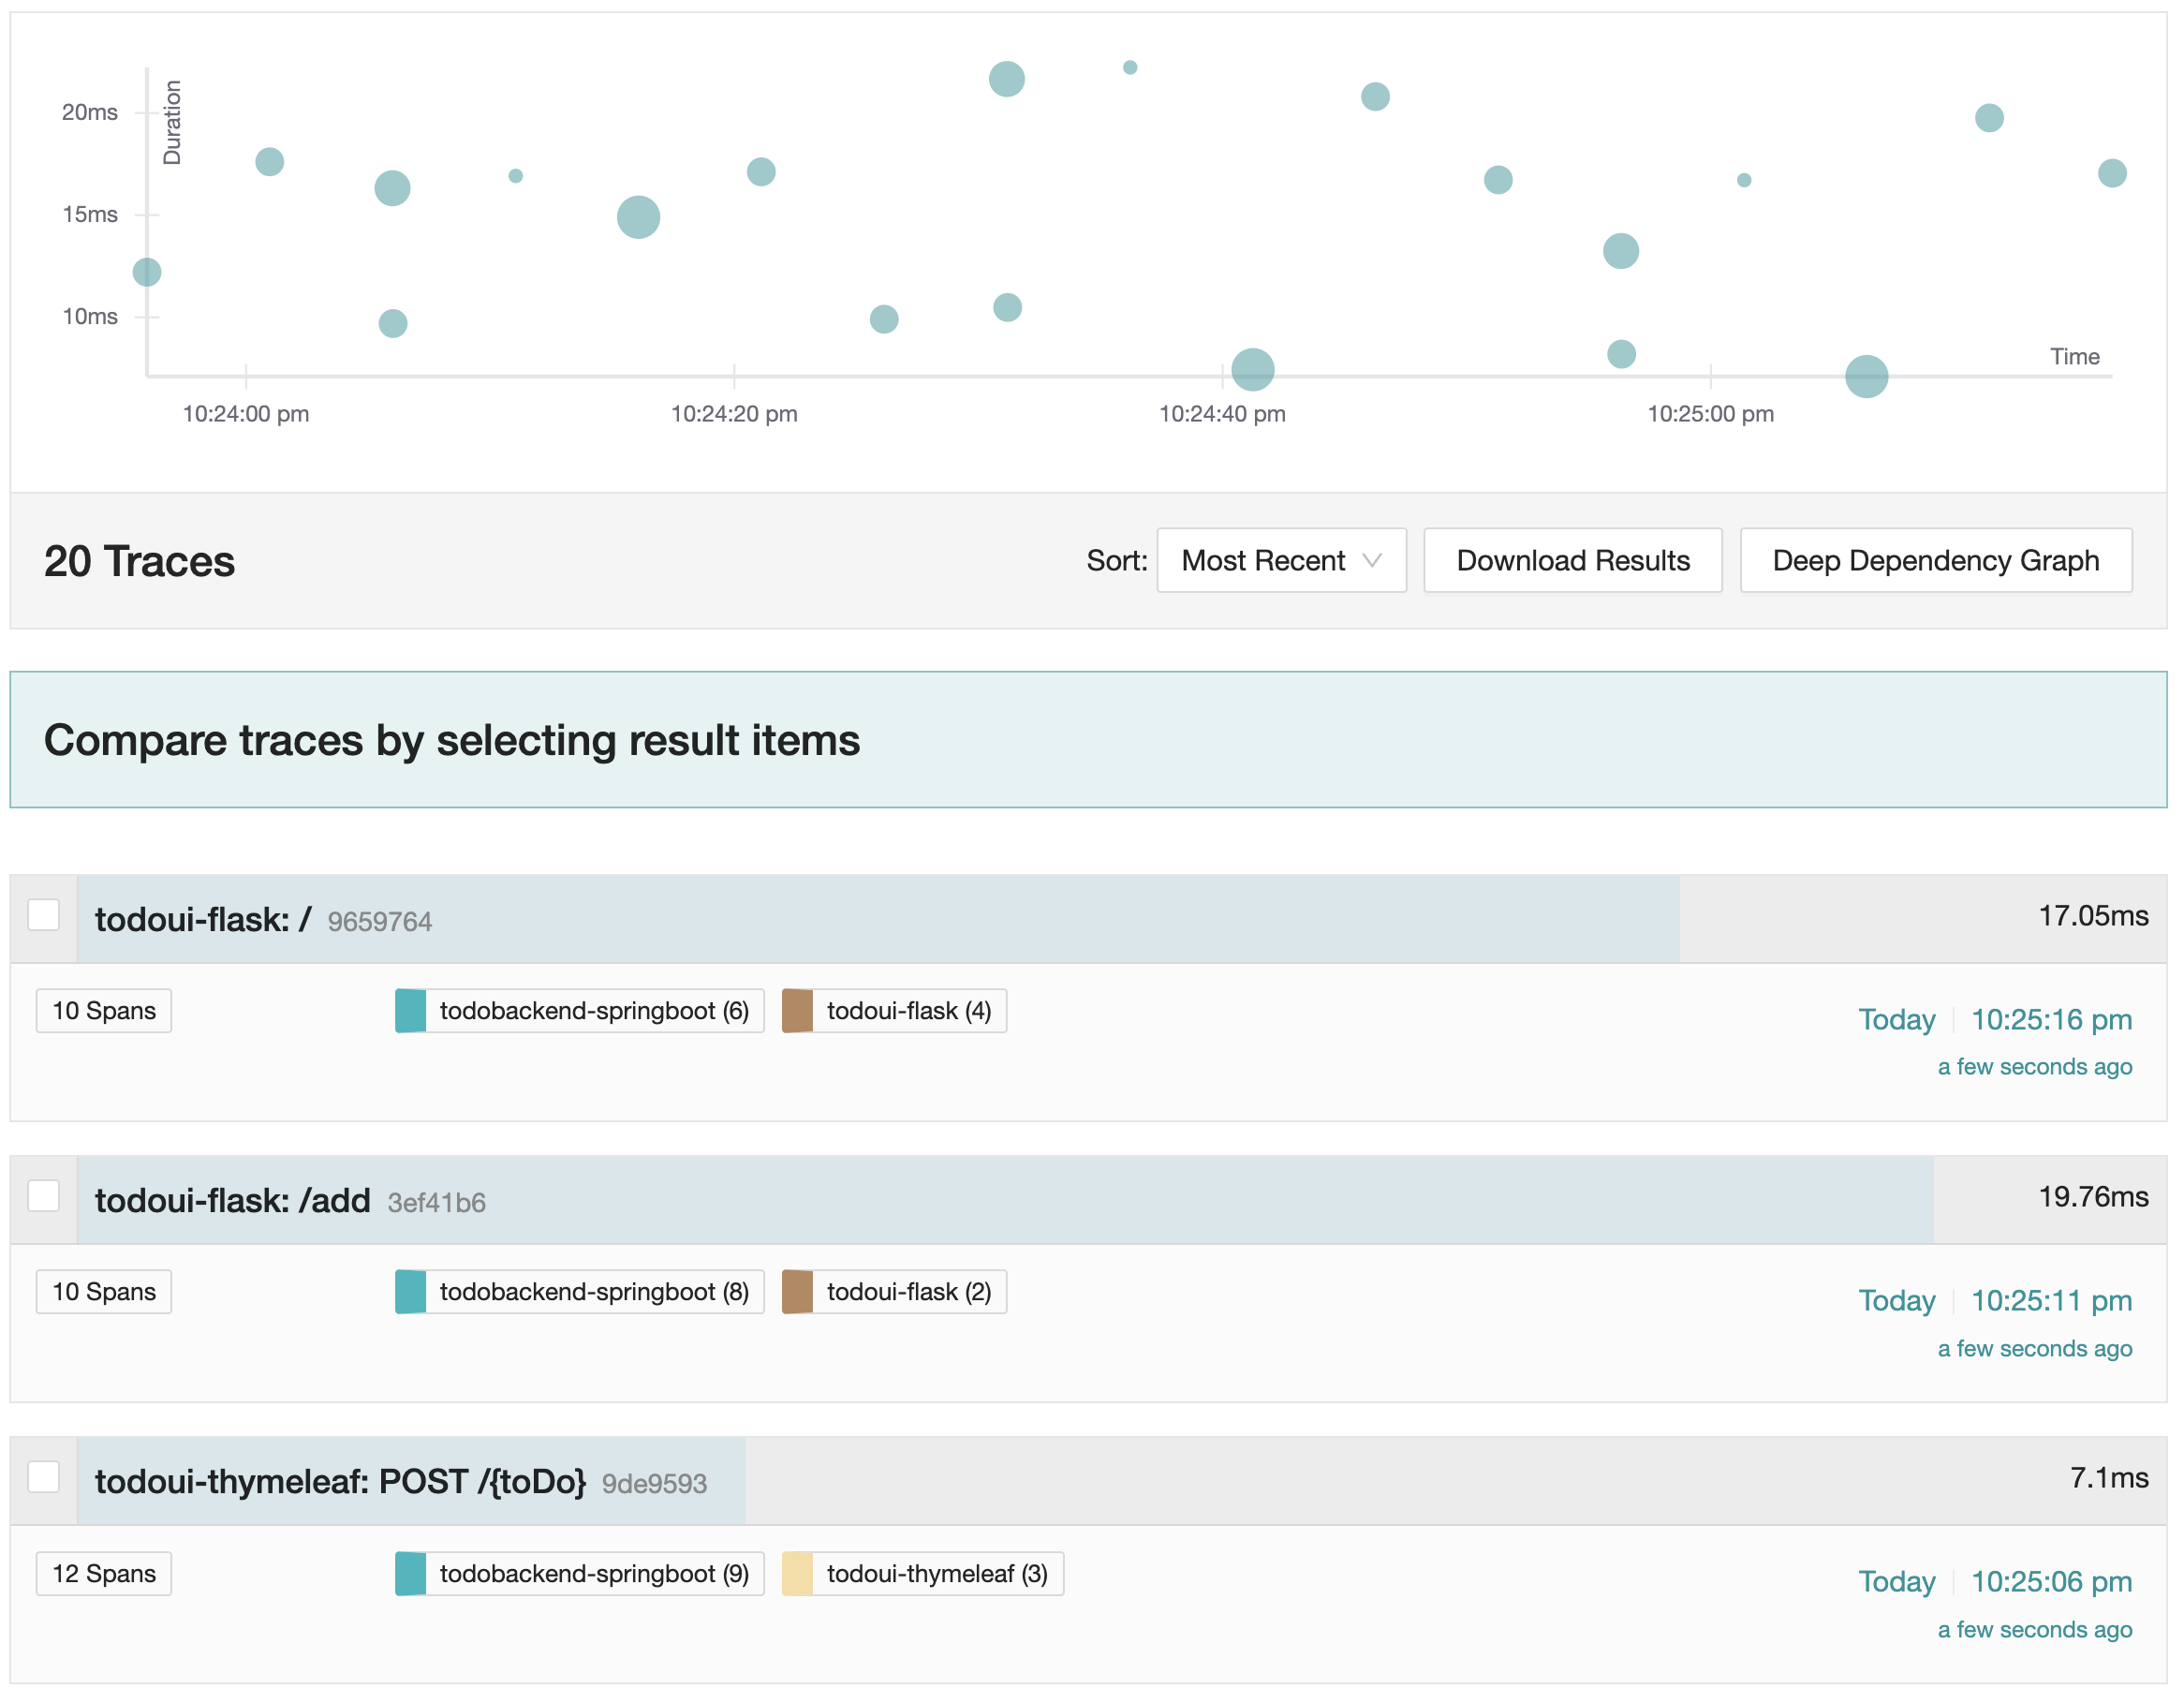
Jaeger recent traces
The diagram on top displays a distribution of collected traces over the last few minutes. The size of the dot indicates the amount of invocations, the x-axis reflects the timestamp and the y-axis states the measured duration.
You can alter the query parameters on the “Search” panel on the left, but since data collection has just started, only the short-term results are most likely meaningful.
In the list of traces, identify one that is called todoui-flask: /add
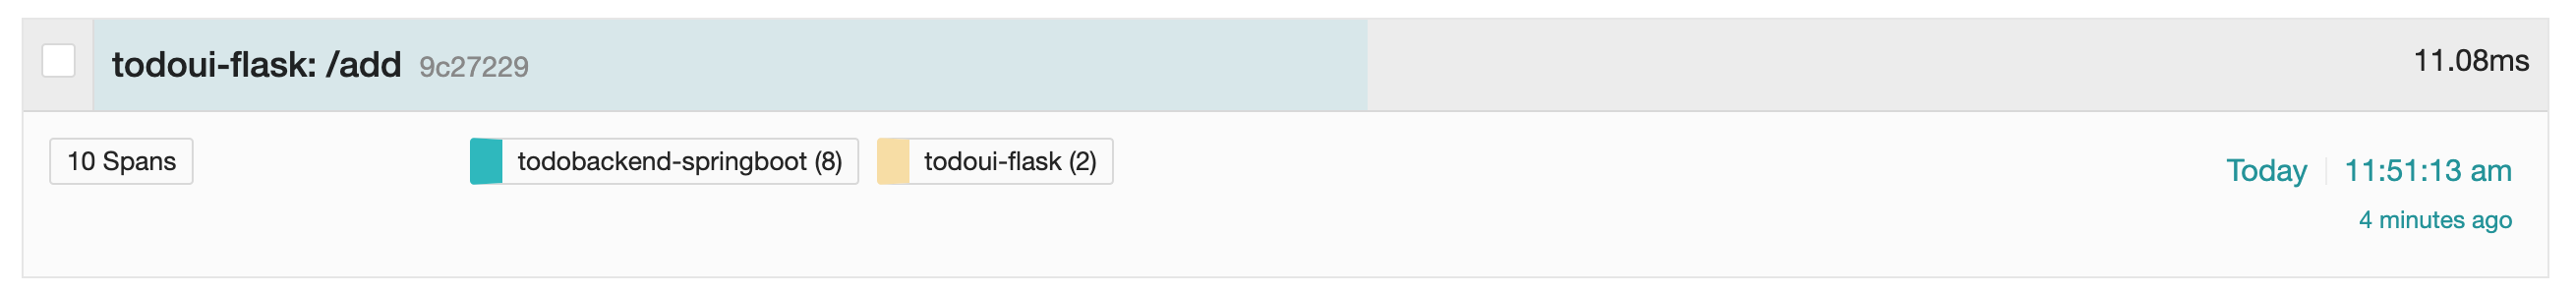
Individual trace
You can see it is a composite of an invocation using both Python and Java components.
Click on it for further analysis. It will take you to the following screen:
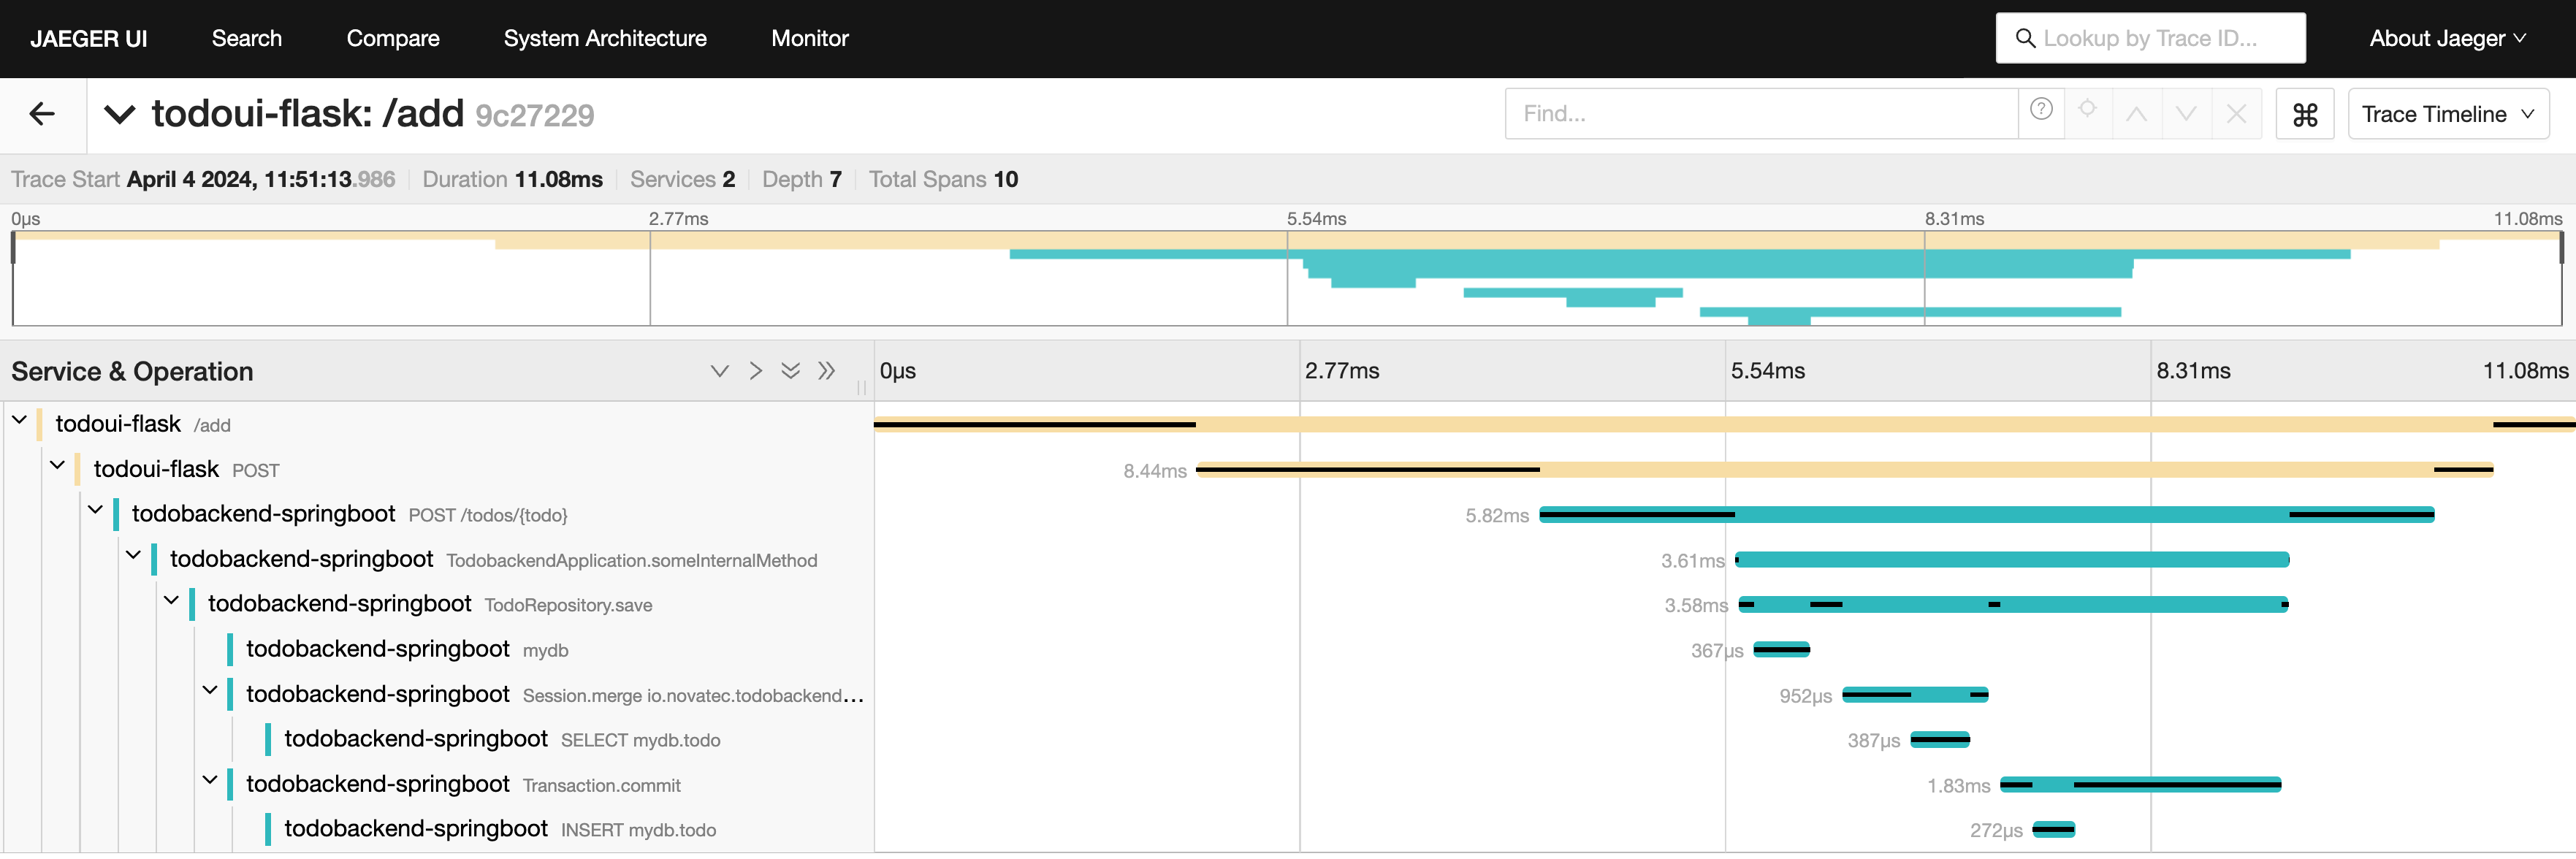
Individual trace
This shows the breakdown of duration times. The outer boundary is the overall trace; each part of it, no matter the nesting level, is called a span. The different application components are highlighted in different colors, so it is easy to spot which part of the overall time was used by the backend component.
There are various ways to interact with this graph. You will see arrows to collapse/expand individual or all sections. If you hover over individual parts, more details are revealed. If you click on a certain span, it will expand a detailed view. Pick the second one in the hierarchy, which is called todoui-flask POST.
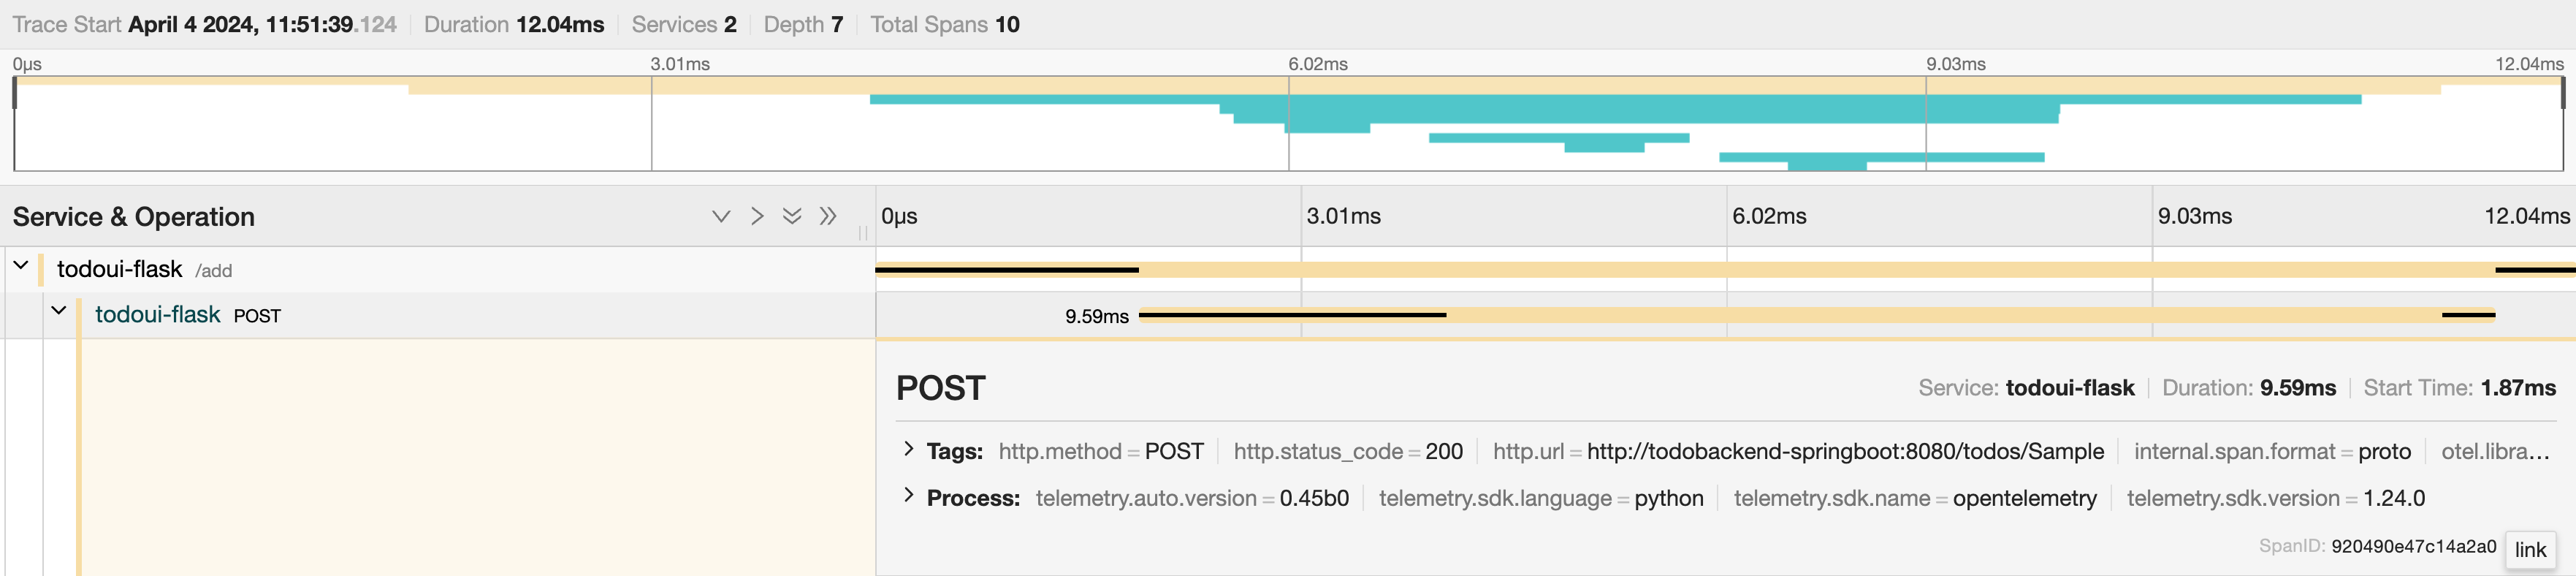
Individual trace with span details
Once clicked, a nested summary of details is shown right underneath the span. If you click on the little twistie left to Tags and Processes more span details are shown.
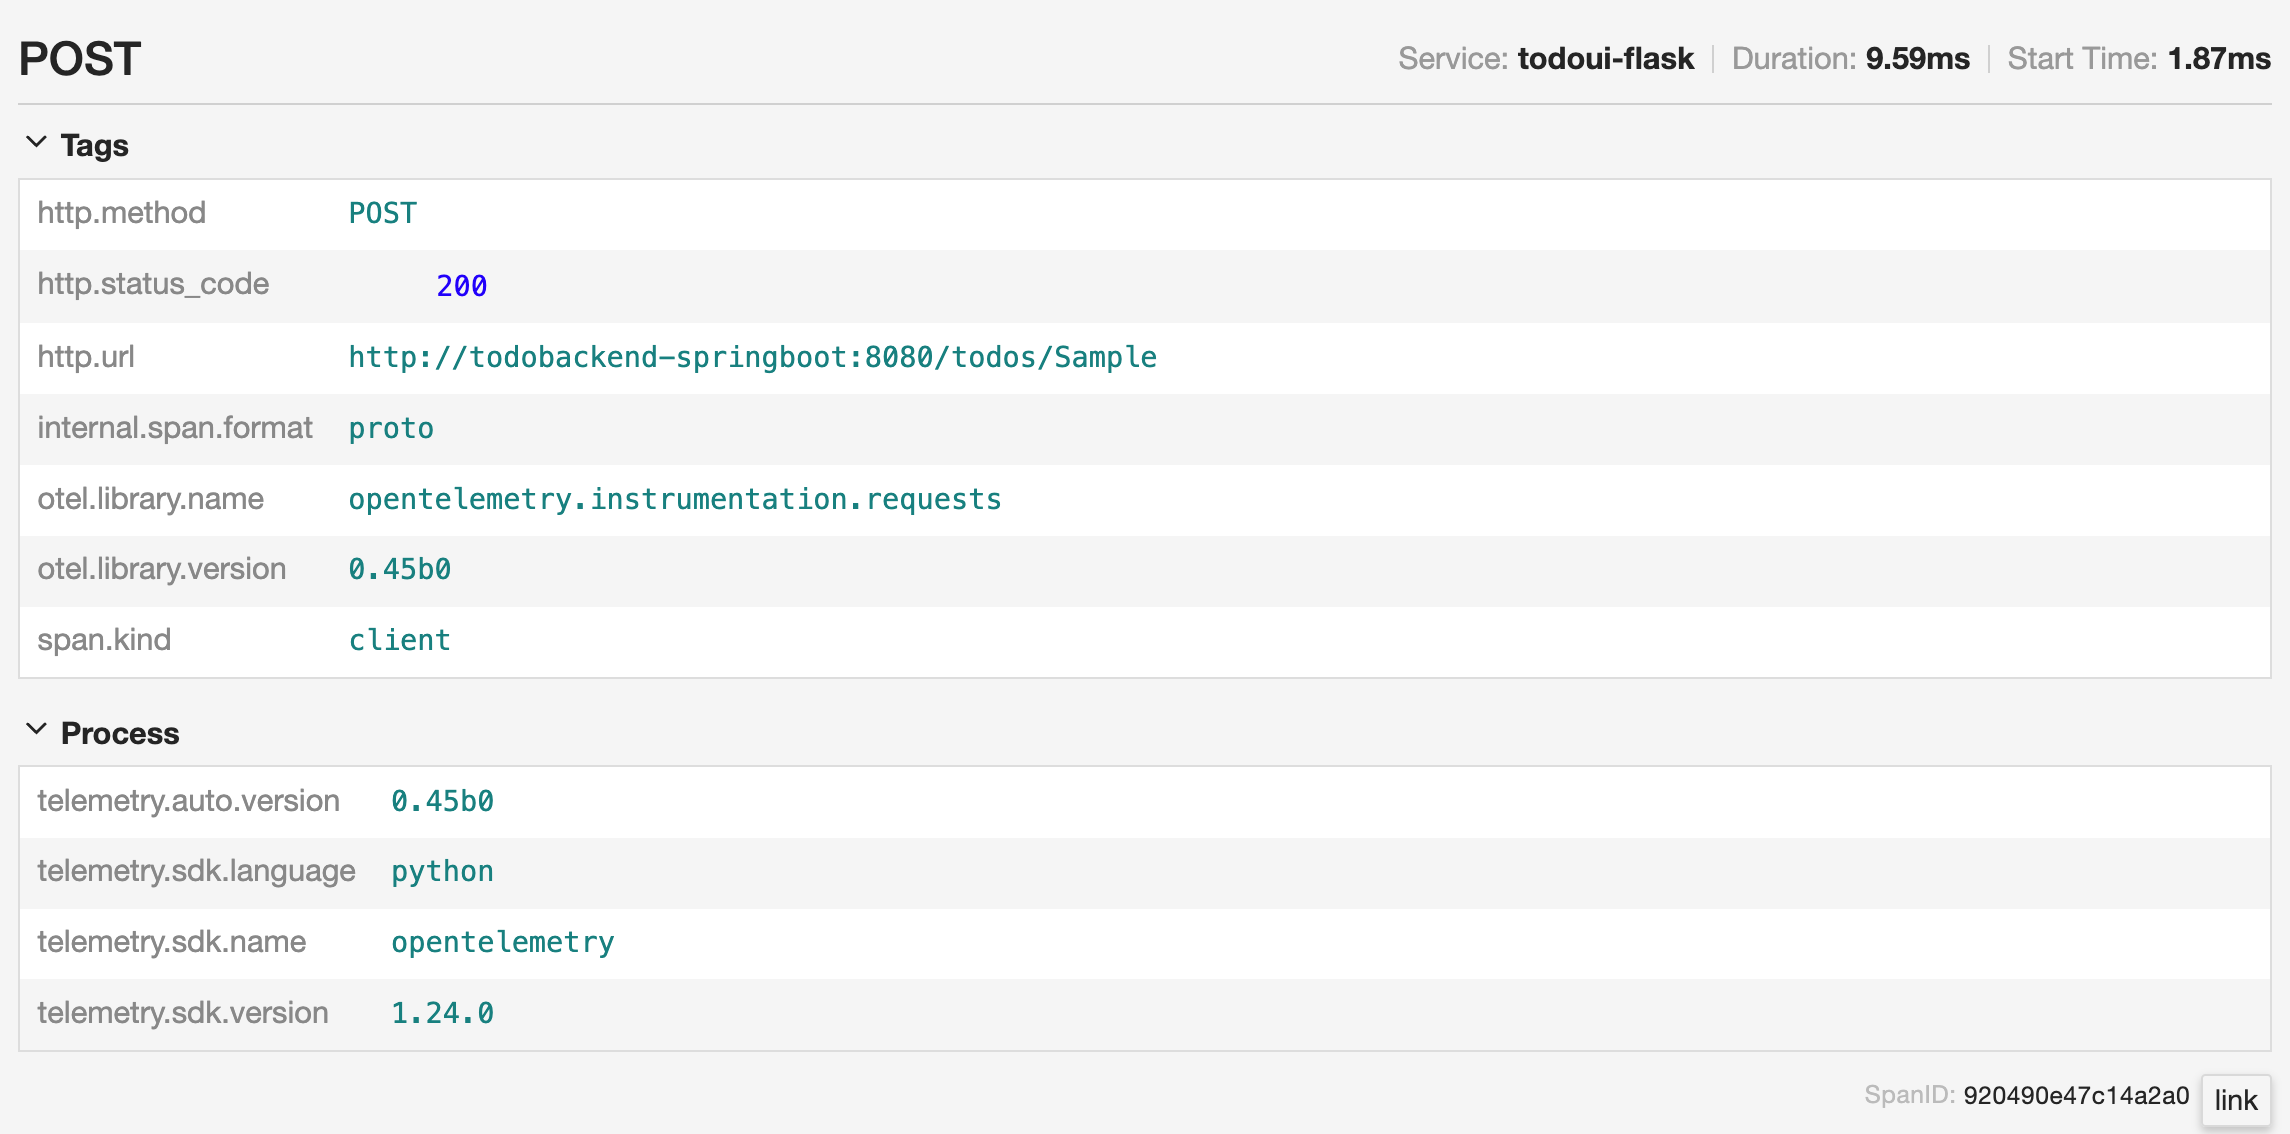
Individual trace with more Python span details
Here you can also get detailed information about the OpenTelemetry collection components being used, e.g. library name, SDK version, etc.
Repeat the same steps and also check the details of a span within the Java component.
Pick the one that says todobackend-springboot TodoRepository.save.
This will list the details of the span that are provided by the implementation of the OpenTelemetry agent. As you can see here, it’s provided by the Java SDK and the Spring Data library in particular.
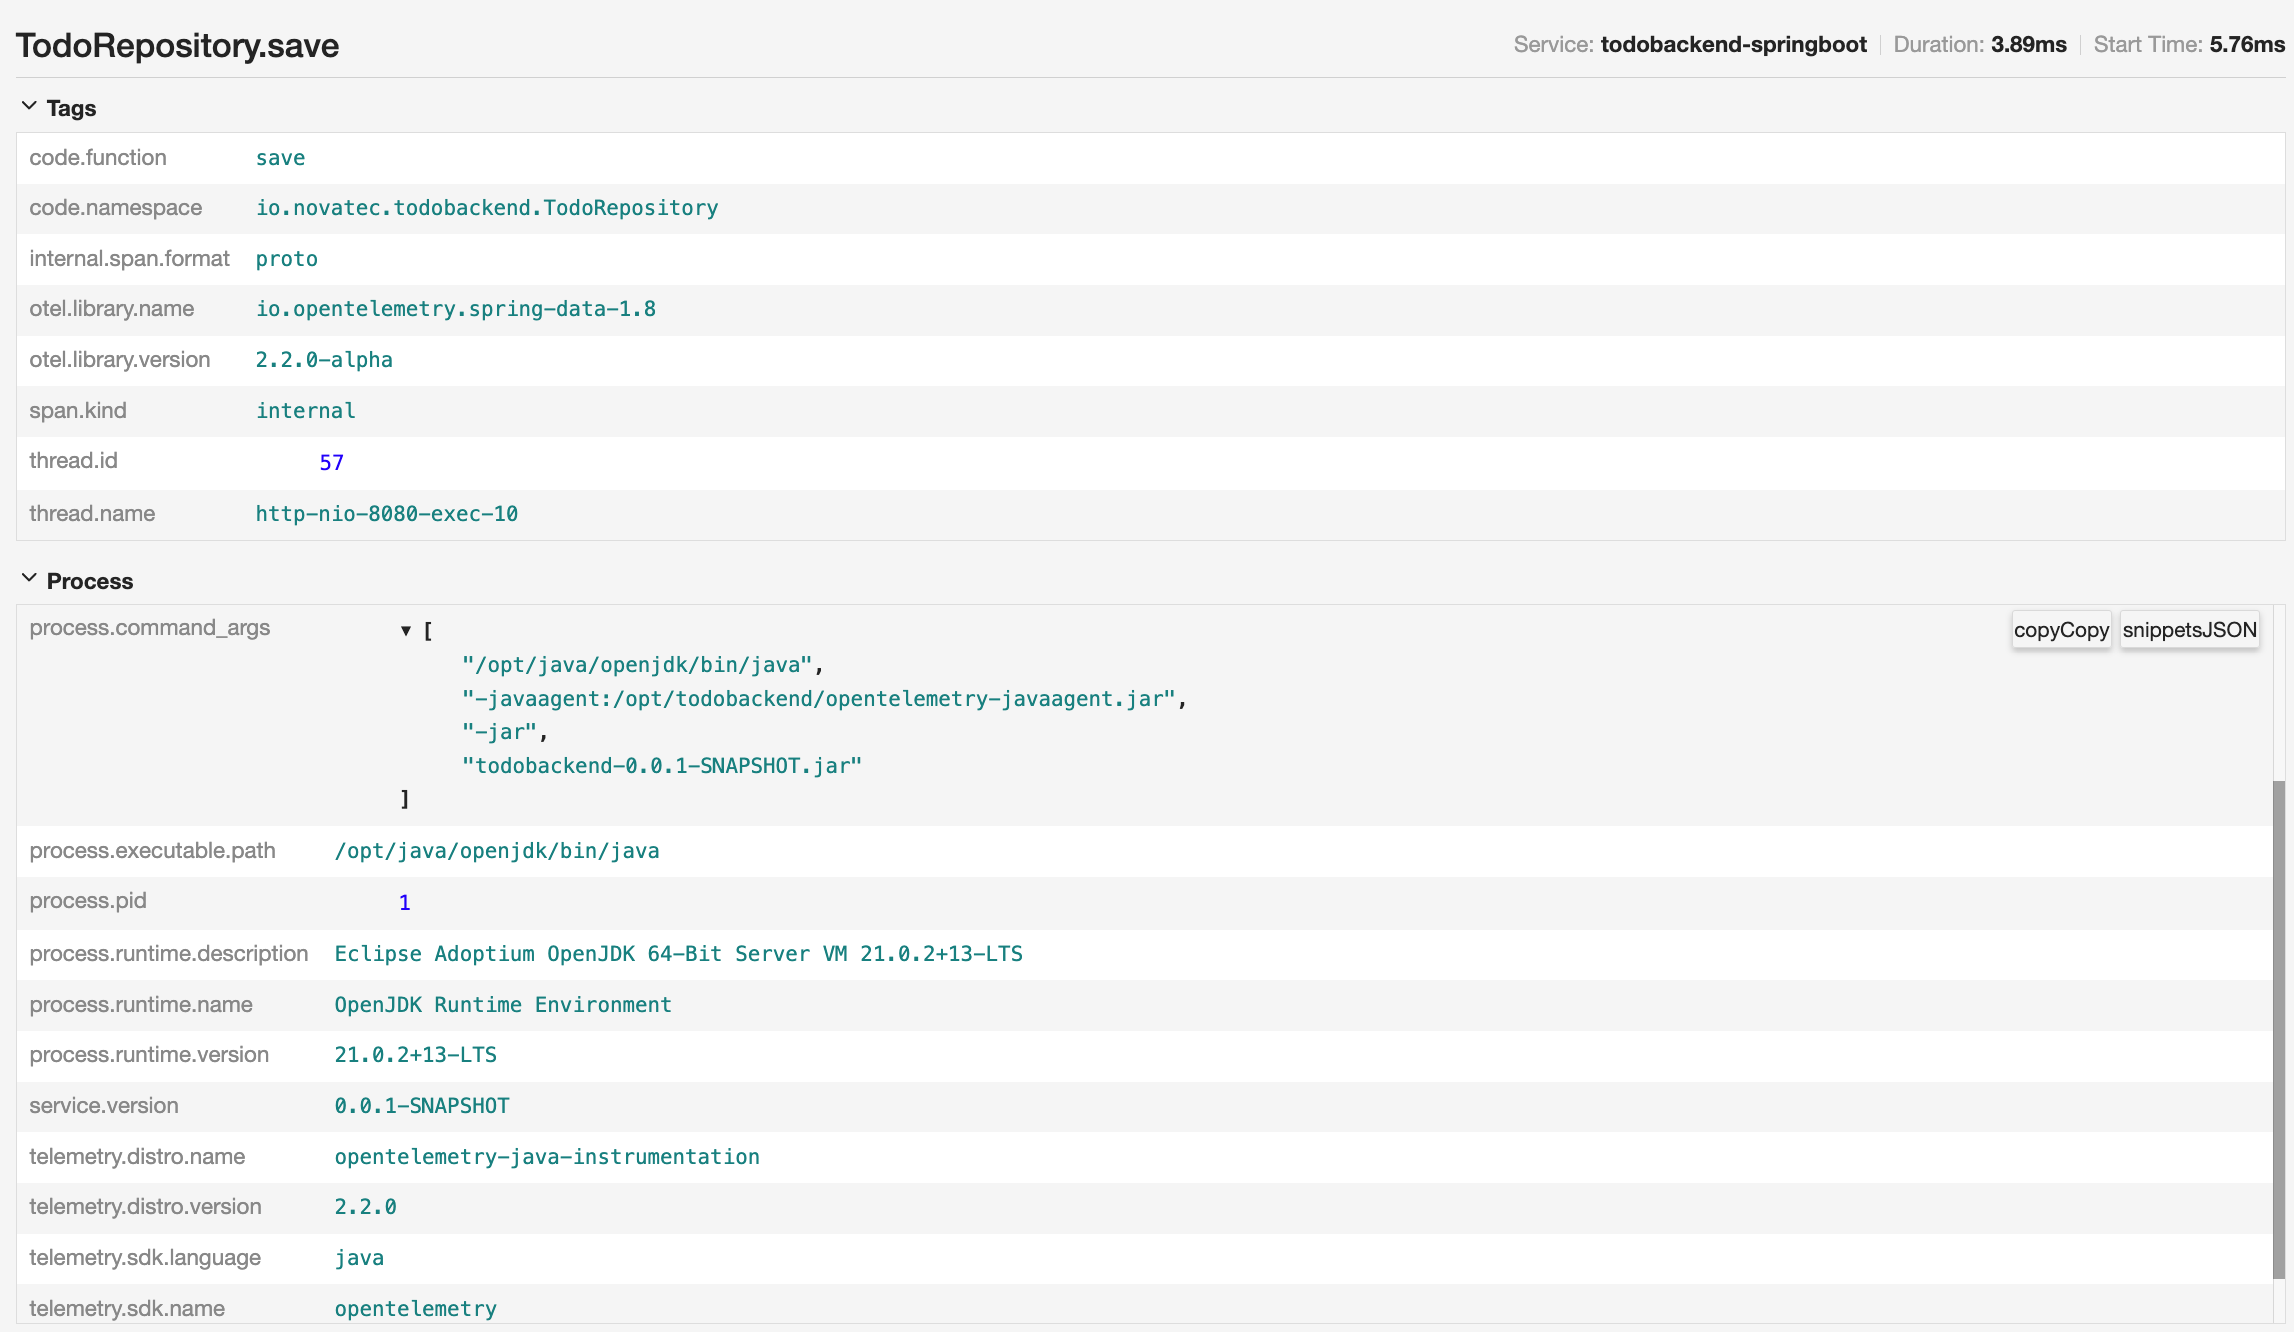
Individual trace with more Spring span details
This also shows that the amount of information can totally differ between different agent implementations. They need to comply with a certain standard so that the information can be used and correlated, but the content may vary.
The instrumentation part of this lab will show how the information in a span can be customized.
Feel free to browse around and look into other span details of the trace.
Simulation of a slow component
Due to the load generator and simple structure of the application, the results in Jaeger won’t have much deviation, so it’s unlikely to spot an anomaly in behavior here.
In order to simulate a decrease in performance, you can add an item called “slow”.
Open the Python or Java frontend and submit an item with this name.
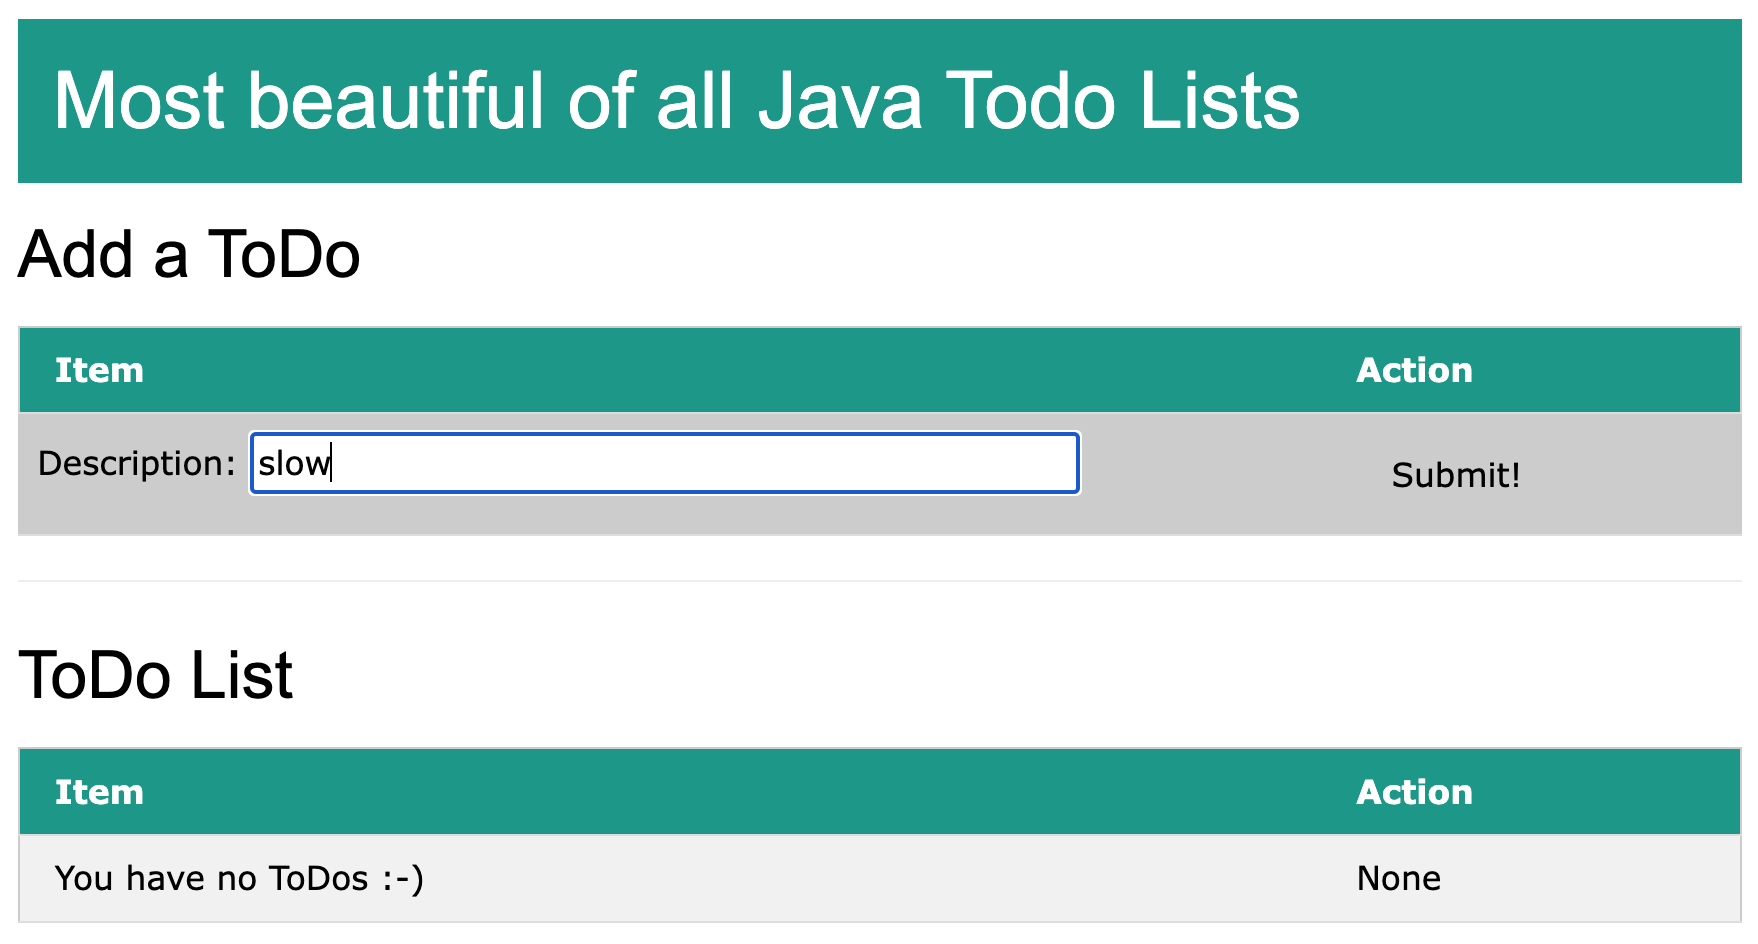
Web UI with new item
You might notice a small delay after submitting the item. The thread is paused for a second. It isn’t much, but it illustrates how easily this can be spotted in the tool.
Repeat the search for all traces again, and you will see a spike in the response time. If it doesn’t show up straight, give it a few seconds and repeat again.
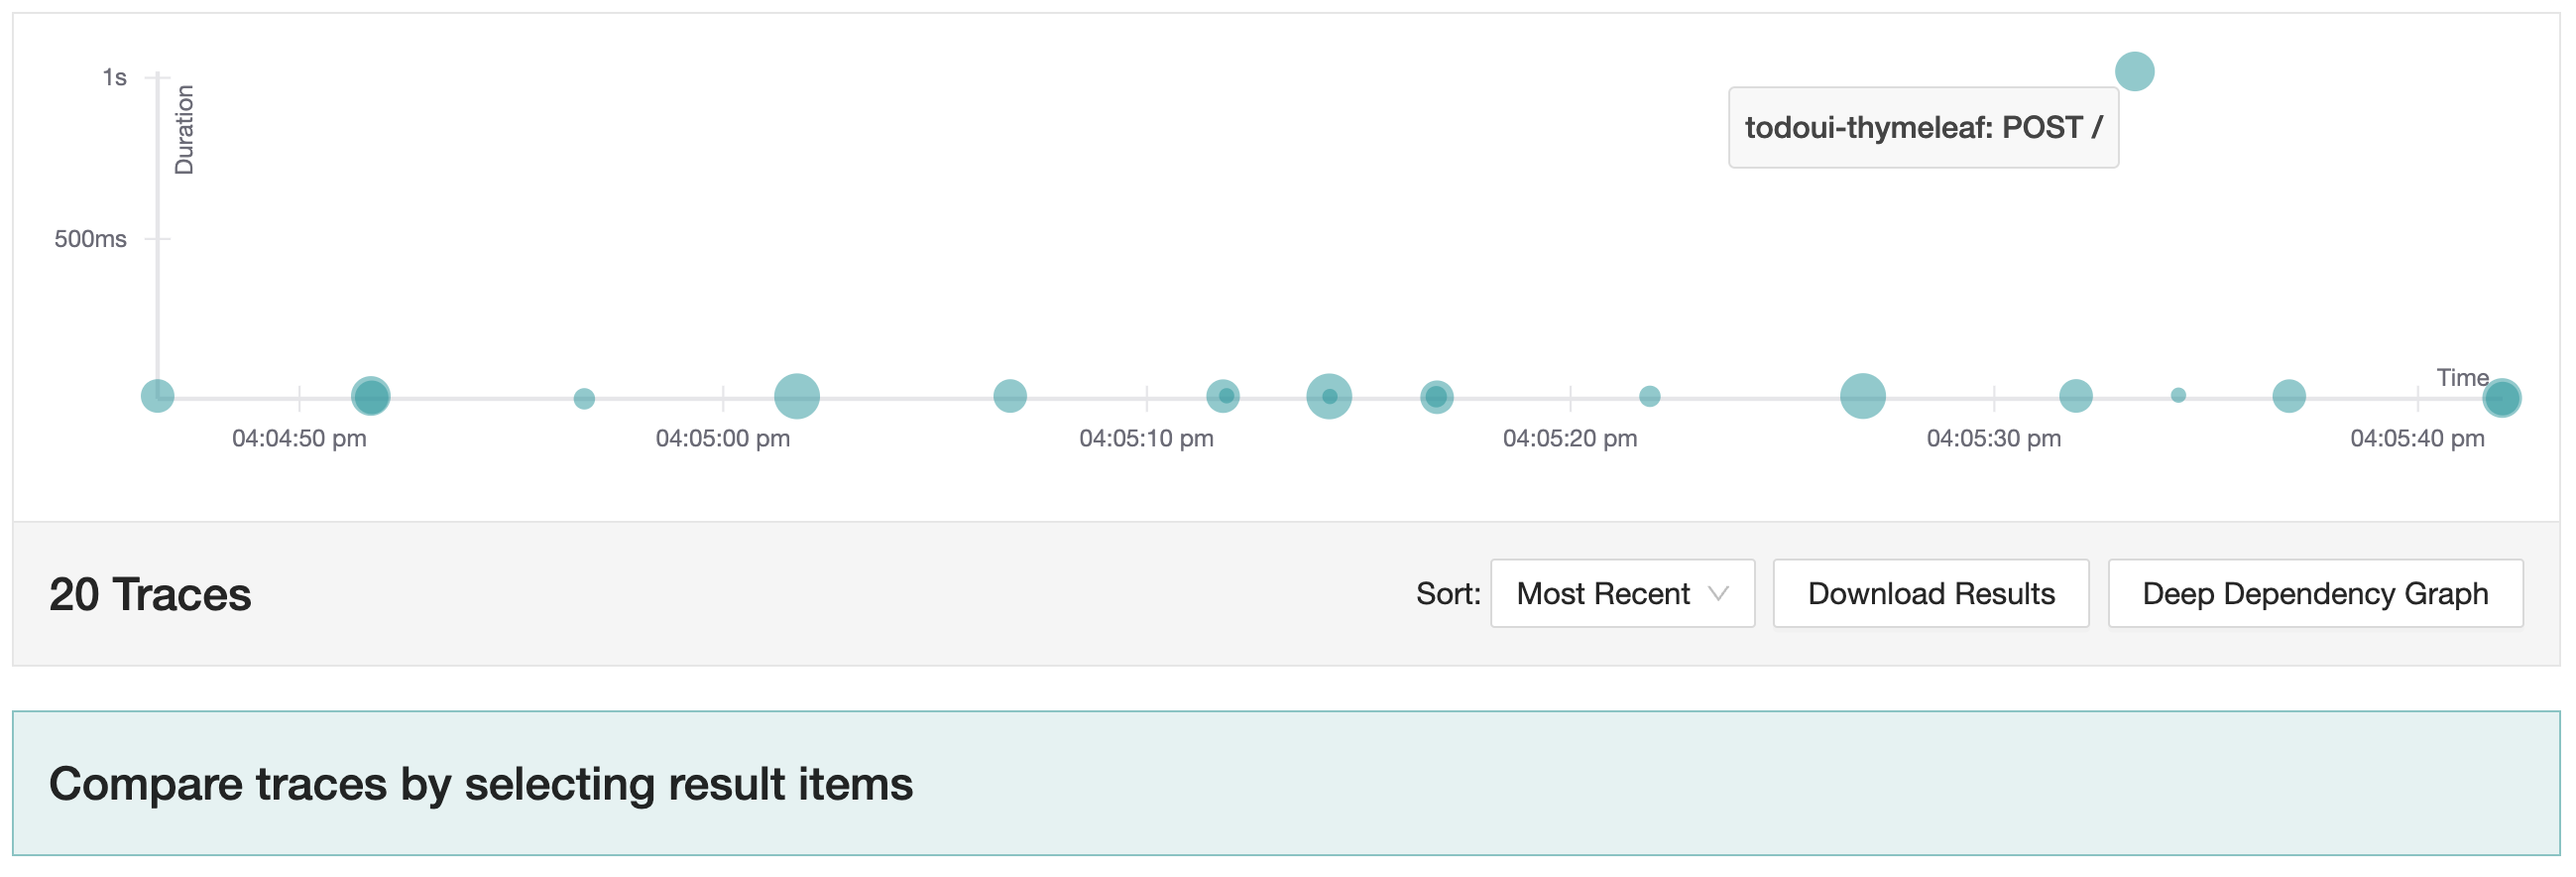
slow
You can actually click directly on the dot in the overview and it will also take you to the corresponding trace. Alternatively, you can select it from the list below.
Web UI with new item
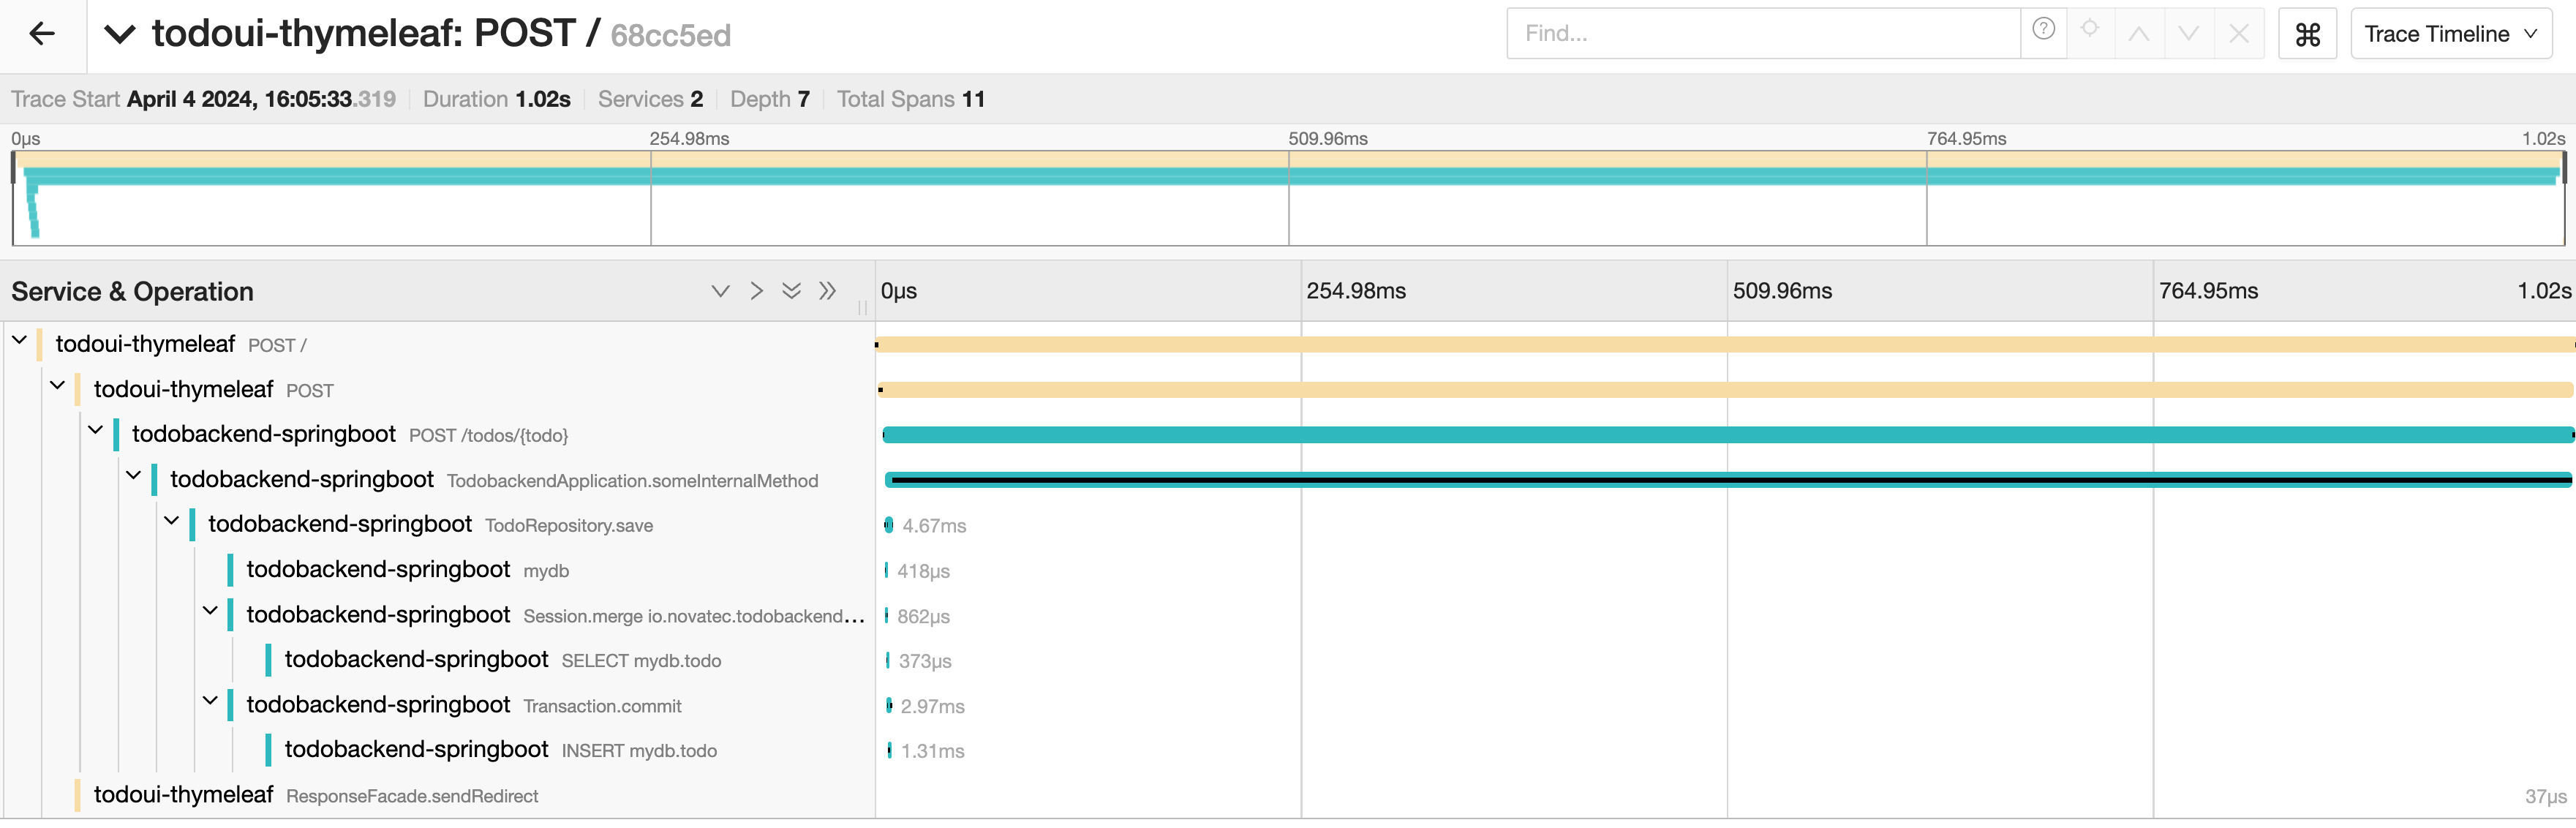
If you look at the trace now, it looks significantly different from what we’ve seen before. There is a dominating span compared to which all other spans look negclectably short in duration. The overall execution time is only slightly above a second whereas one span takes an entire second.
In a real-world scenario, isolating a poor-performing component is probably not as obvious, but for showcasing how things work, this should do for now.
Click on the long-running span to reveal more details.
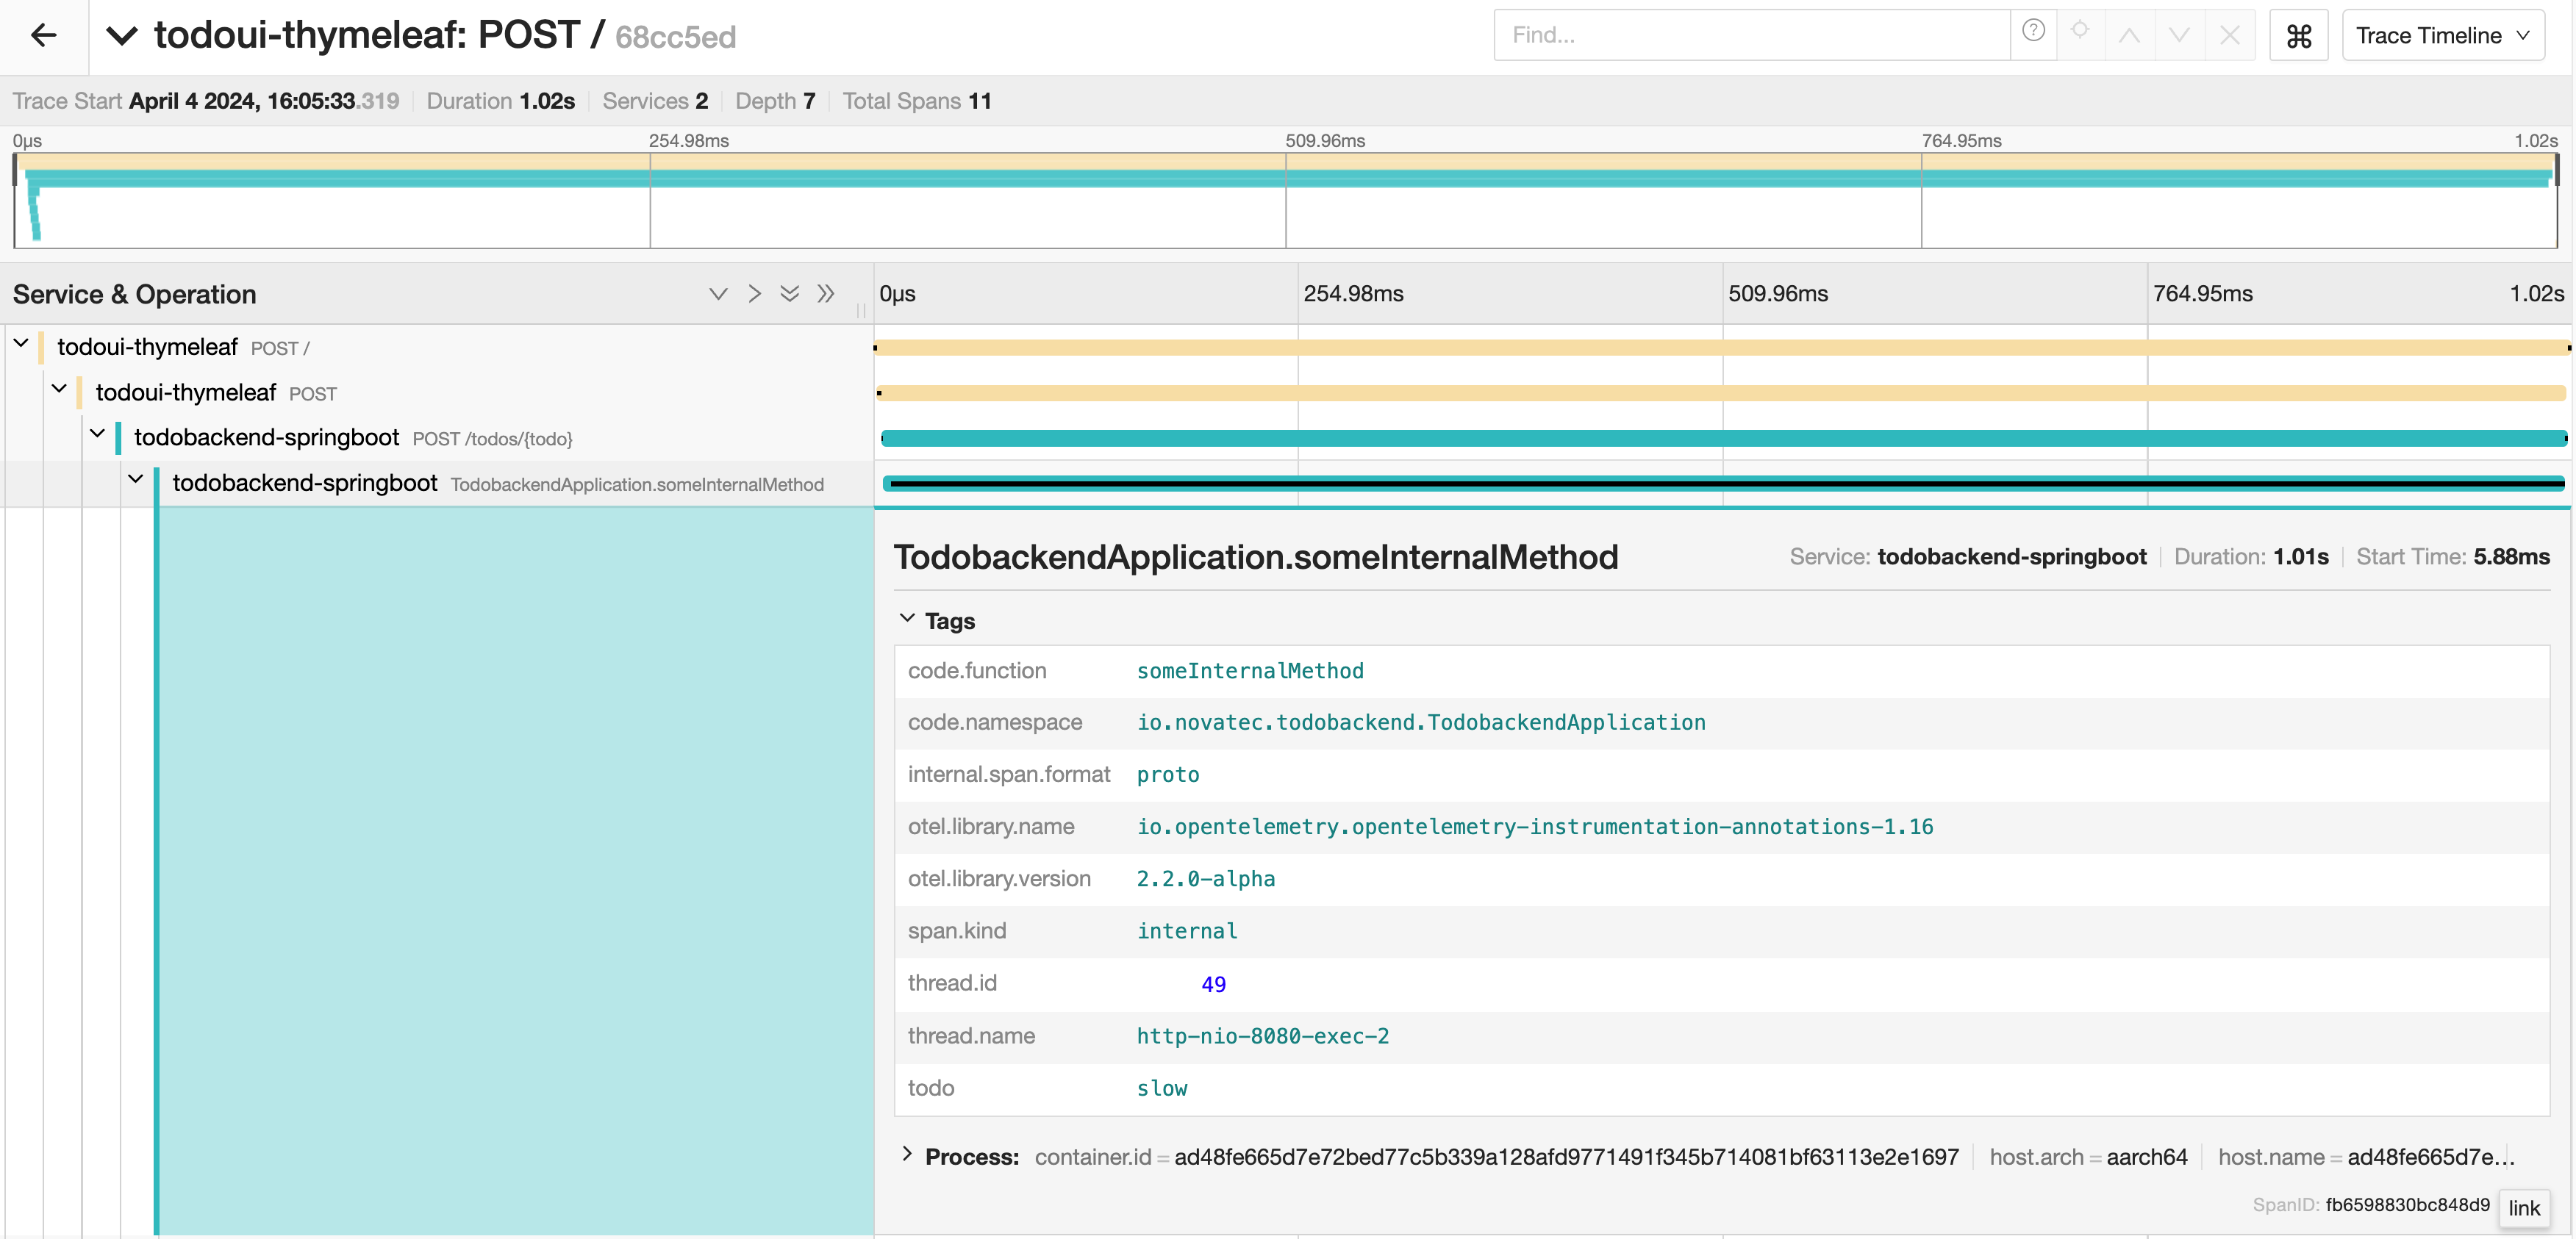
Web UI with new item
This shows the details provided by the OpenTelemetry agent. With the knowledge of package, class and method name it is easier to continue debugging at this point.
Simulation of a failing component
Besides the slow running component you can also simulate a failure in this lab. If you enter “fail” instead of “slow”, it will cause a RuntimeException on the backend component.
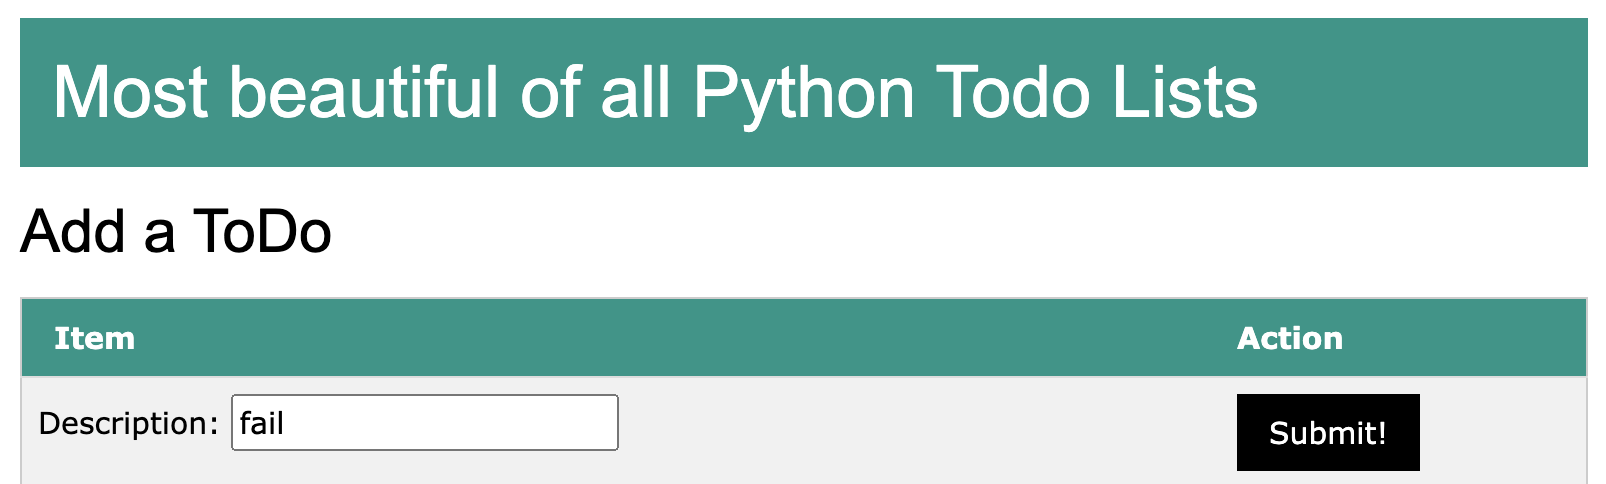
Web UI with new item
This will also display an error on the frontend. It looks slightly different depending which one you use.
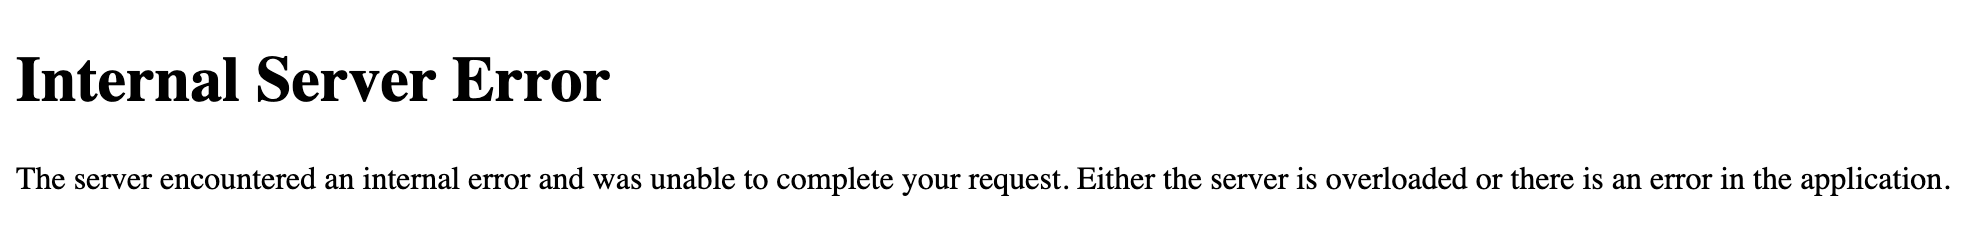
Failure on Flask side
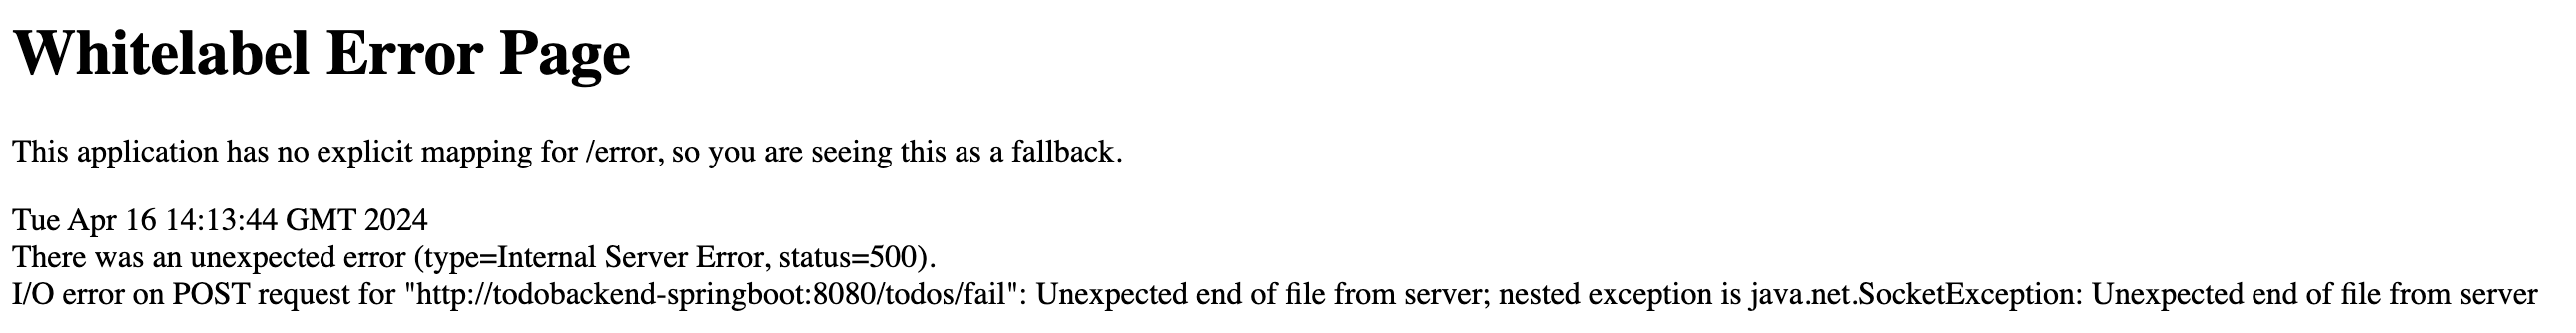
Failure on Thymeleaf side
Now switch back to the Jaeger UI and see how this is being displayed.
If you look at the recent traces of your component you will see a trace highlighted in a different colour (red):
Error in recent traces
Select it to show the details of the trace with errors.
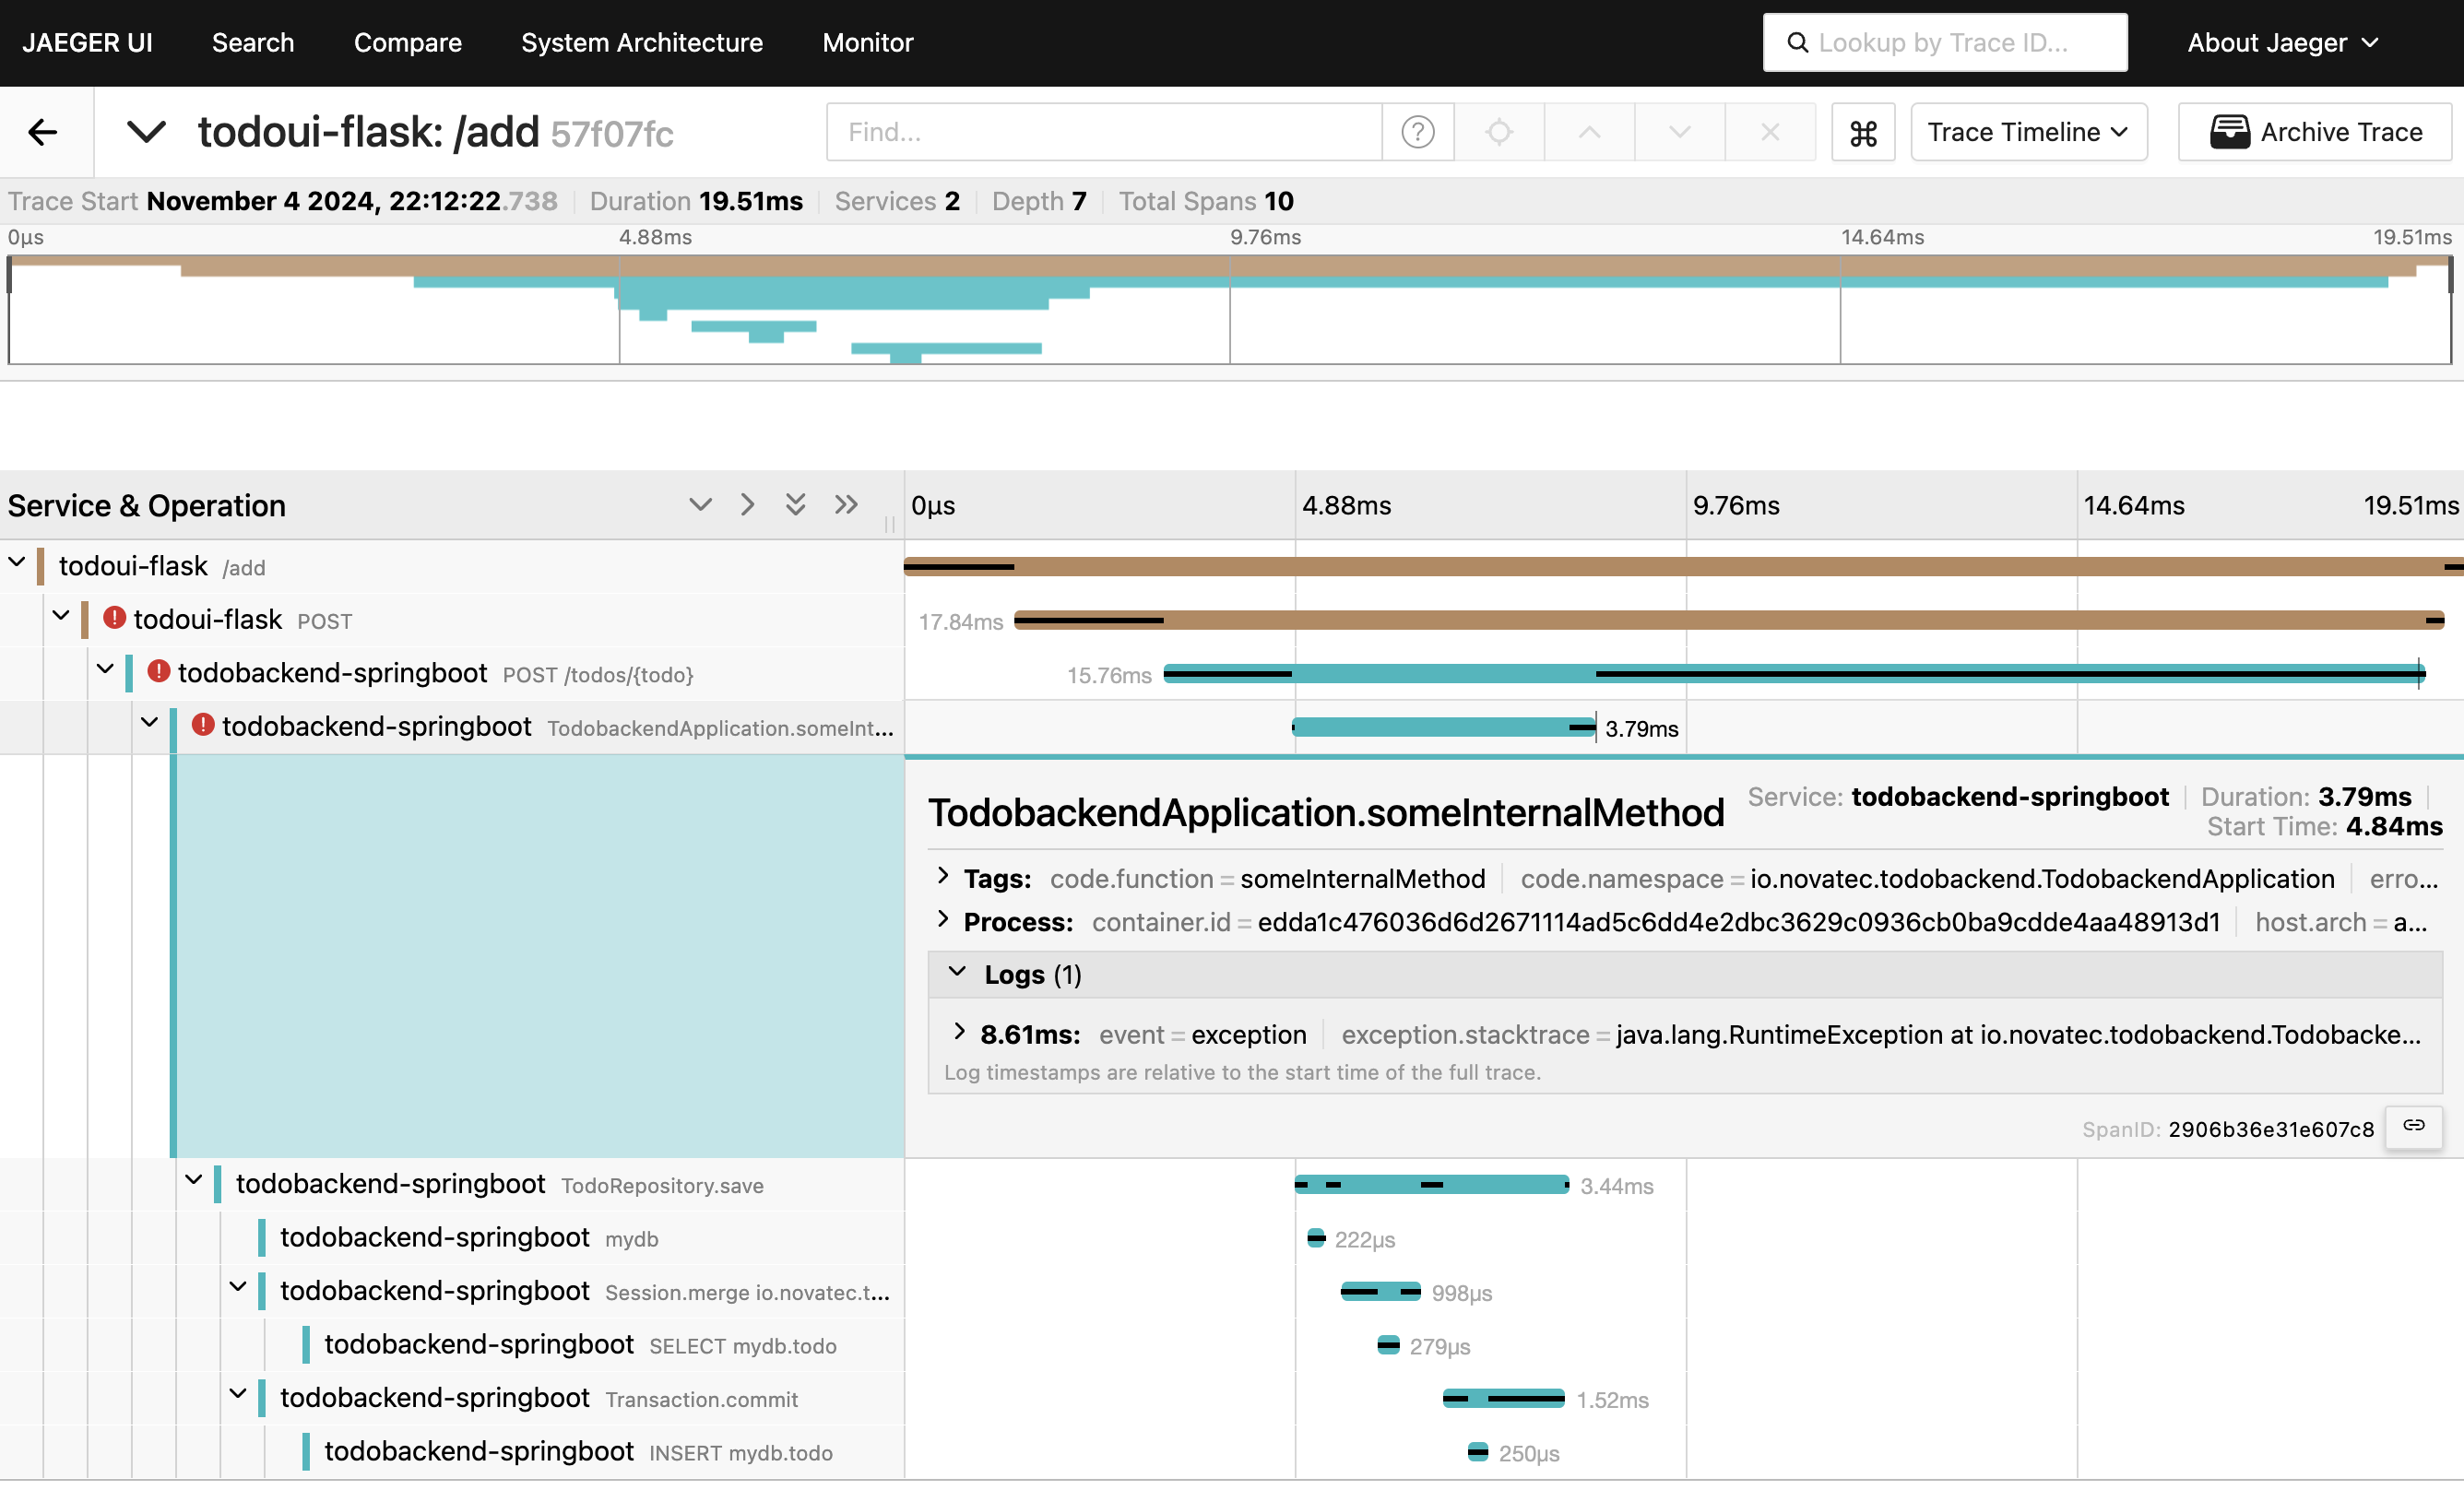
Error in trace
It is worth noting that the error surfaces in the frontend component (and not in the backend, where it actually happens).
For those familiar with Java this is the underlying code snippet:
	String someInternalMethod(@SpanAttribute String todo){

		todoRepository.save(new Todo(todo));

		if(todo.equals("slow")){
			try {
				Thread.sleep(1000);
			} catch (InterruptedException e) {
				e.printStackTrace();
			}
		}
		if(todo.equals("fail")){

			System.out.println("Failing ...");
			throw new RuntimeException();

		}
		return todo;

	}
It means that the actual value of the entered todo item is being saved to the database. Just before the method returns the RuntimeException is thrown. This is also why you see the save method and deeper level methods in the stack. However the invoking method is not displayed.
If you expand the call of the save method in Jaeger you will also be able to see a warning that the parent span is missing. This one never got completed because of the breaking exception.
Comparing traces
There are many things you can do with all the observability data being collected by OpenTelemetry. This totally depends on the third-party tool functionality how the information is being displayed.
So the following part is less about what OpenTelemetry provides, but more about how Jaeger evaluates it.
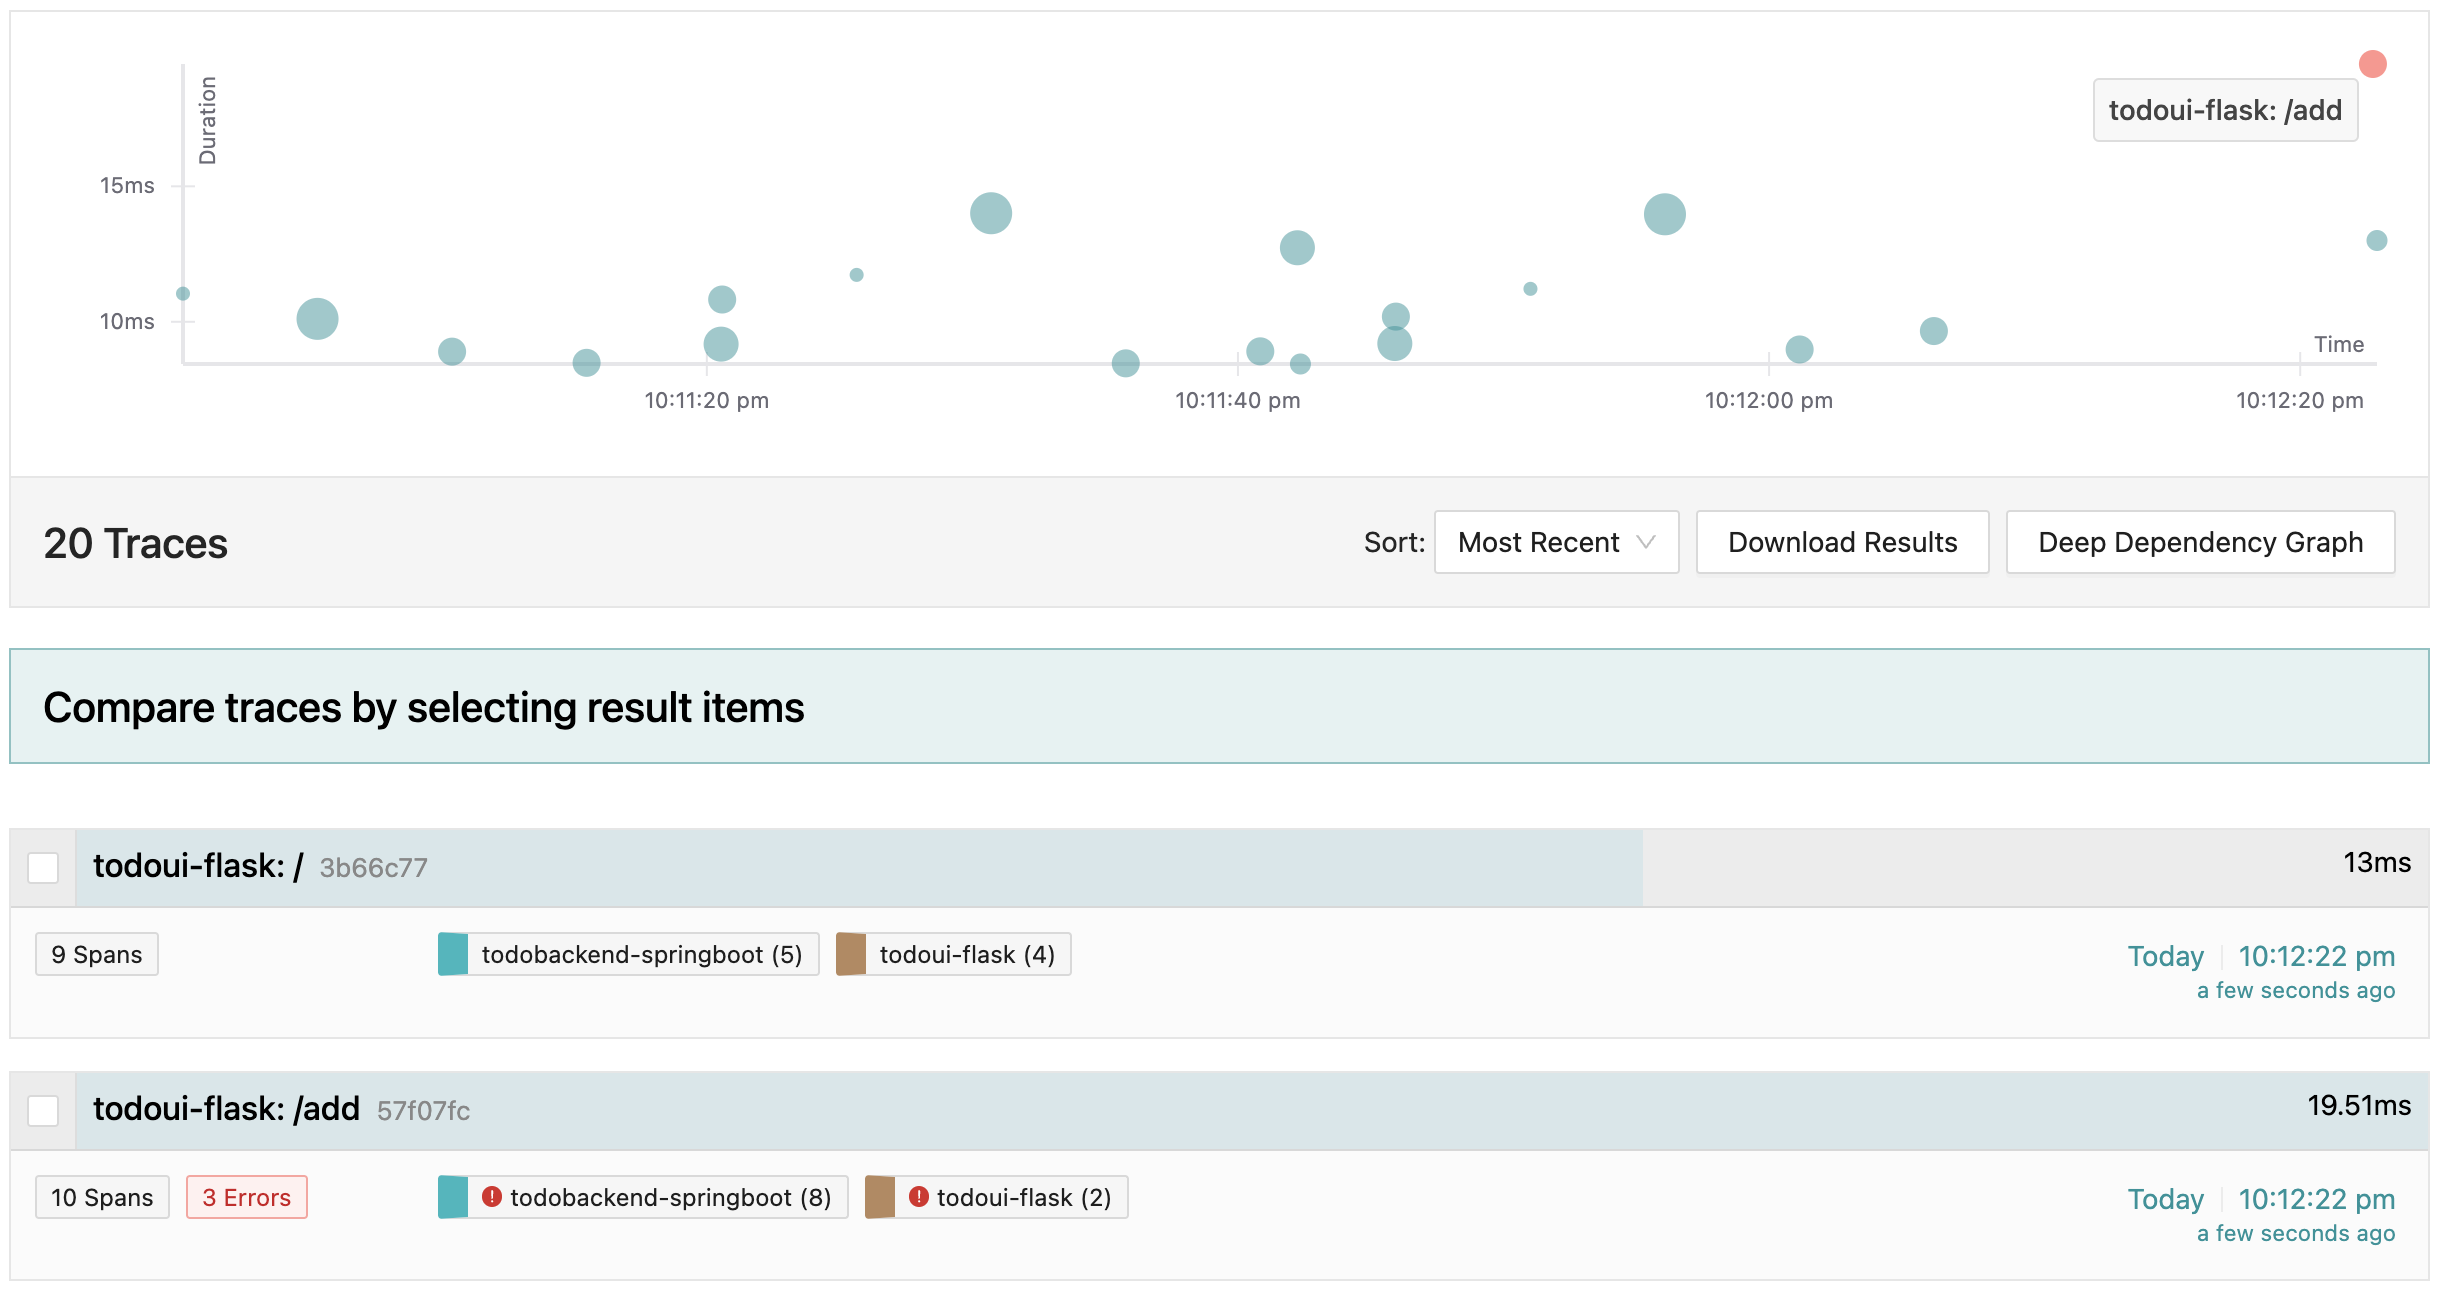
Search for all traces with the default settings again. This time let’s try to compare the Python to the Java invocation for the call to quuery all Todo items.
Once you have the list, select the todoui-flask: / and the todoui-thymeleaf: GET /.
There will probably be many invocations of this type by now, any pair of them will do.
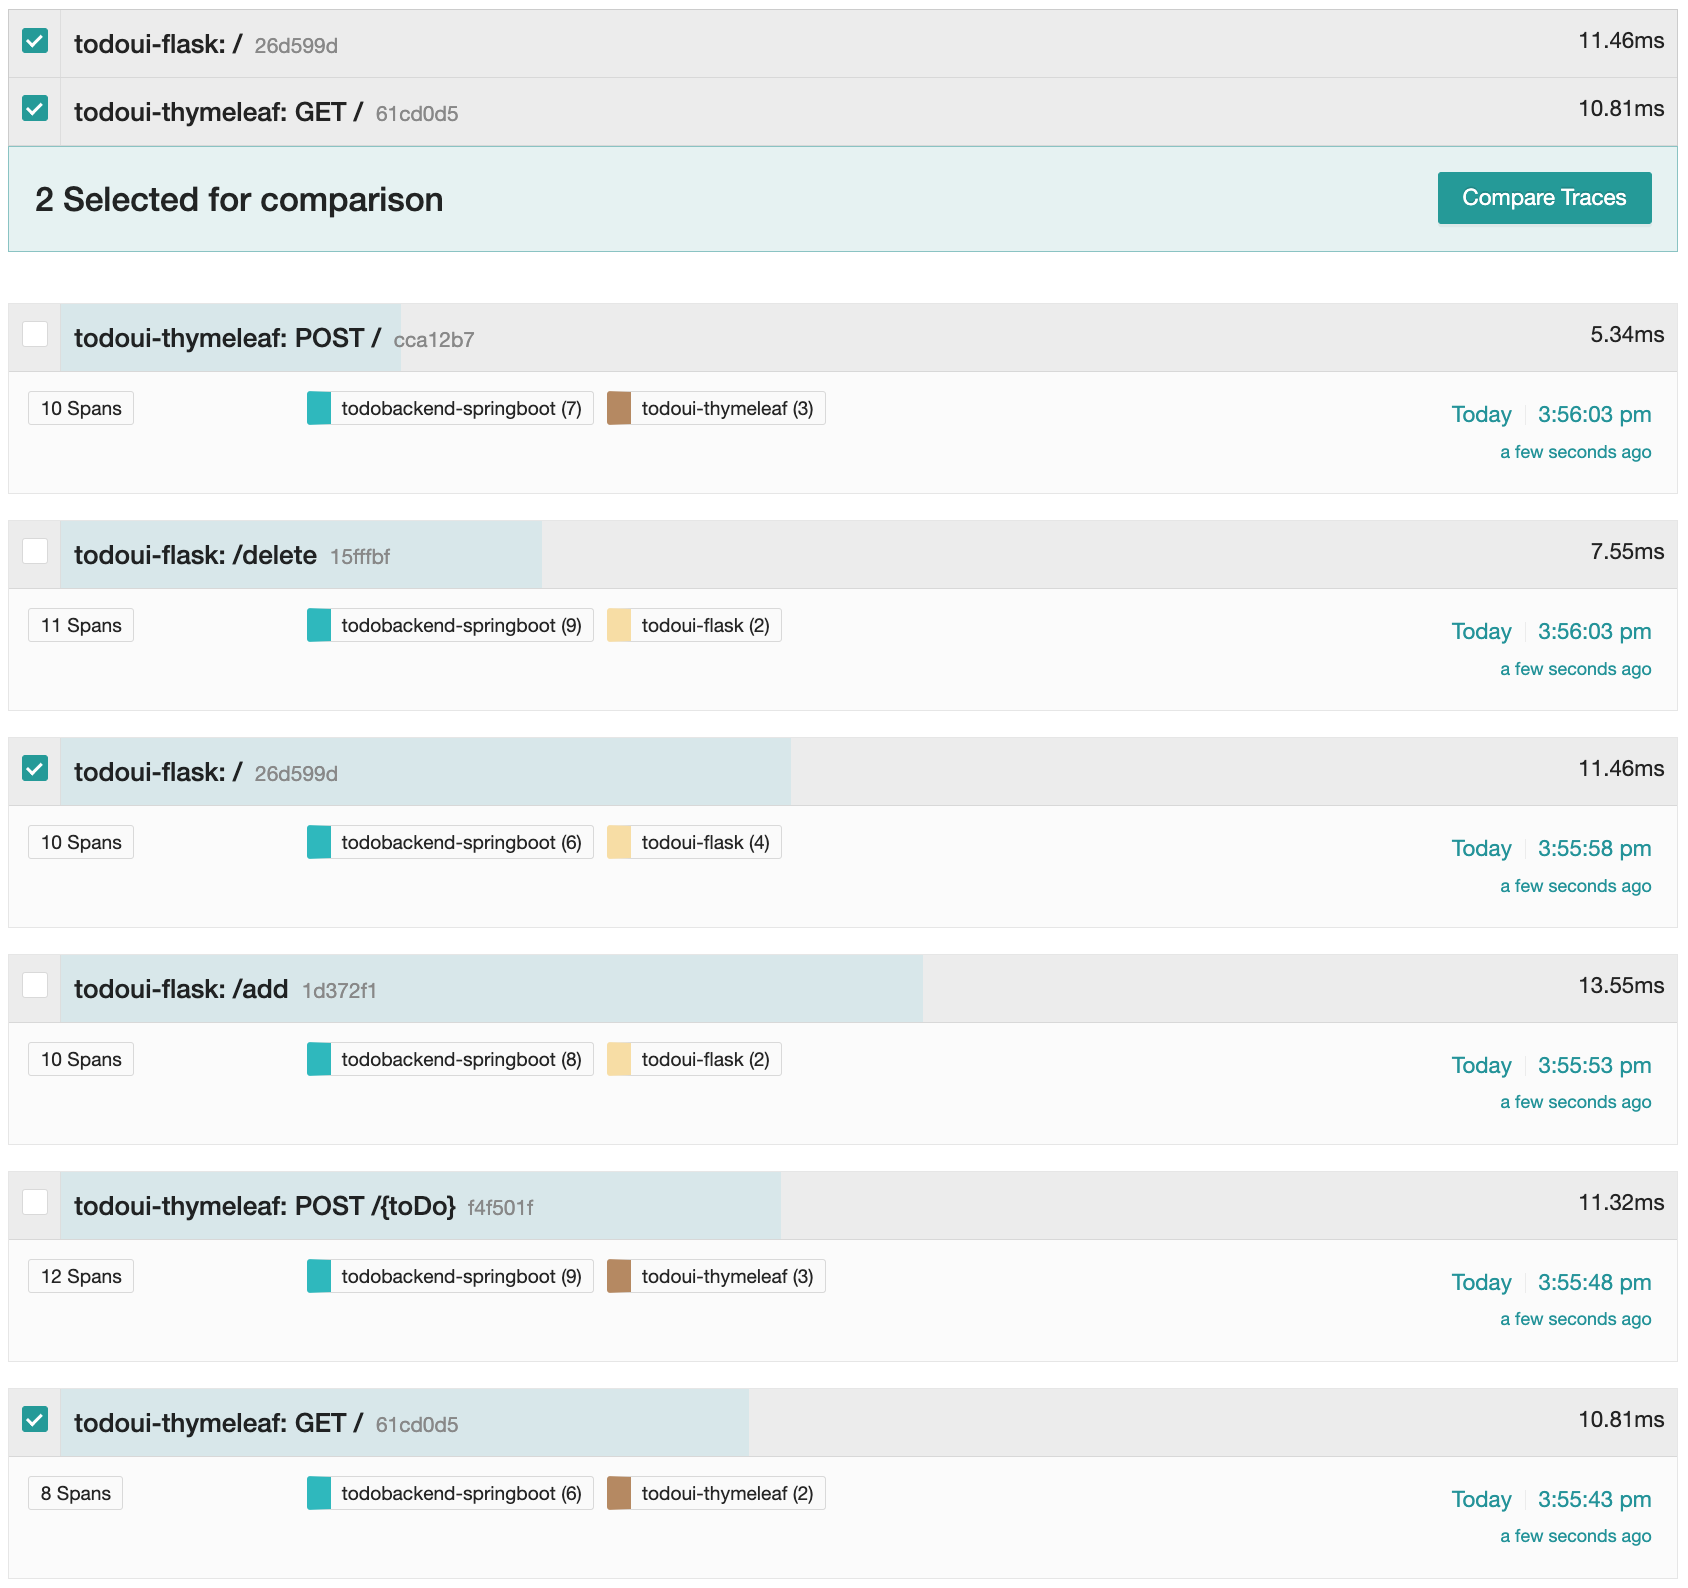
Web UI with new item
Click on “Compare Traces”. A new window will show up, displaying the traces in a visual flow next to each other. This also shows a different collection of spans for the Java and Python part to the left and an identical one for the backend on the right.
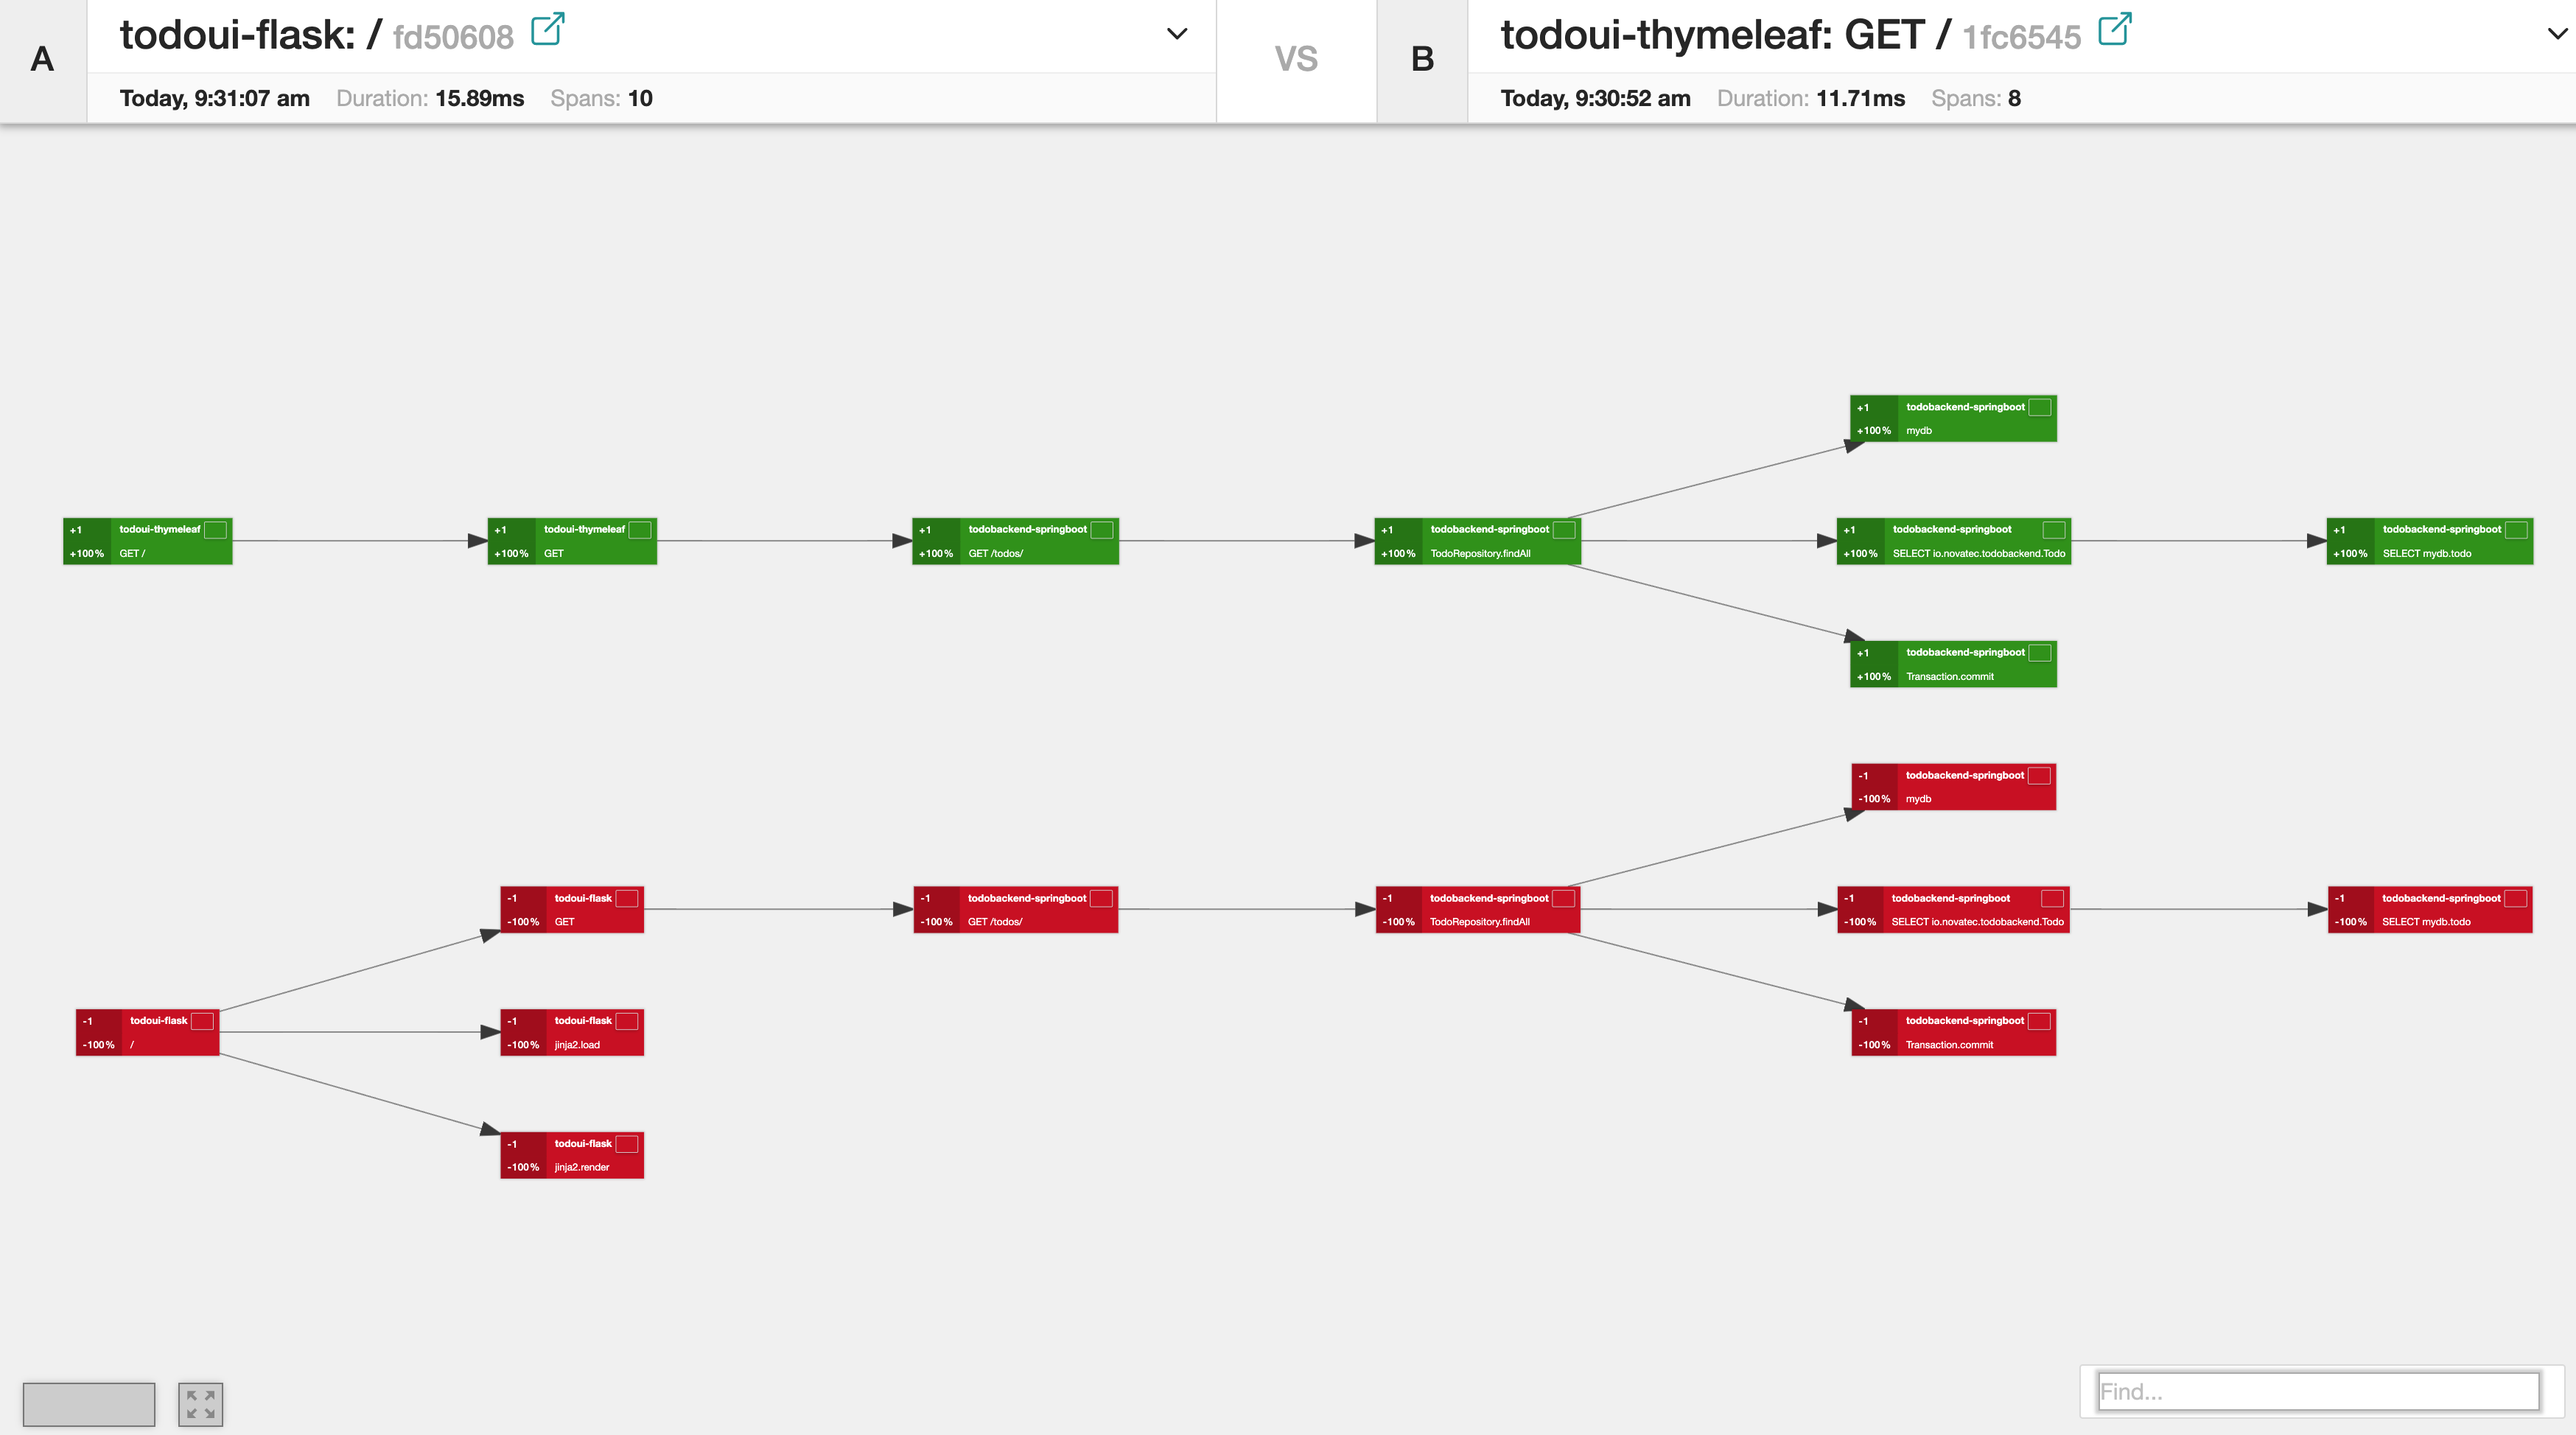
Web UI with new item
Of course this also makes a lot of sense to compare multiple traces of exactly the same invocation type at different times. Hope you like this!
Metrics
Next to tracing OpenTelemetry also provides the ability to export metrics information to various third-party applications. For this scenario we used the popular option Prometheus.
The OpenTelemetry Collector is configured to export the metrics to the Prometheus exporter. Prometheus is an open-source monitoring solution that stores metrics in a time-series database. It follows a pull-based approach, which means that Prometheus scrapes the metrics from its targets.
In our case, Prometheus is configured to scrape metrics from an endpoint exposed by the OpenTelemetry Collector.
A very common way to visualize Prometheus is via dashboards inside Grafana. However, Prometheus also has a built-in frontend, which will do fine for this use case.
You can access the web UI at the following link.
The main entry screen looks like this:
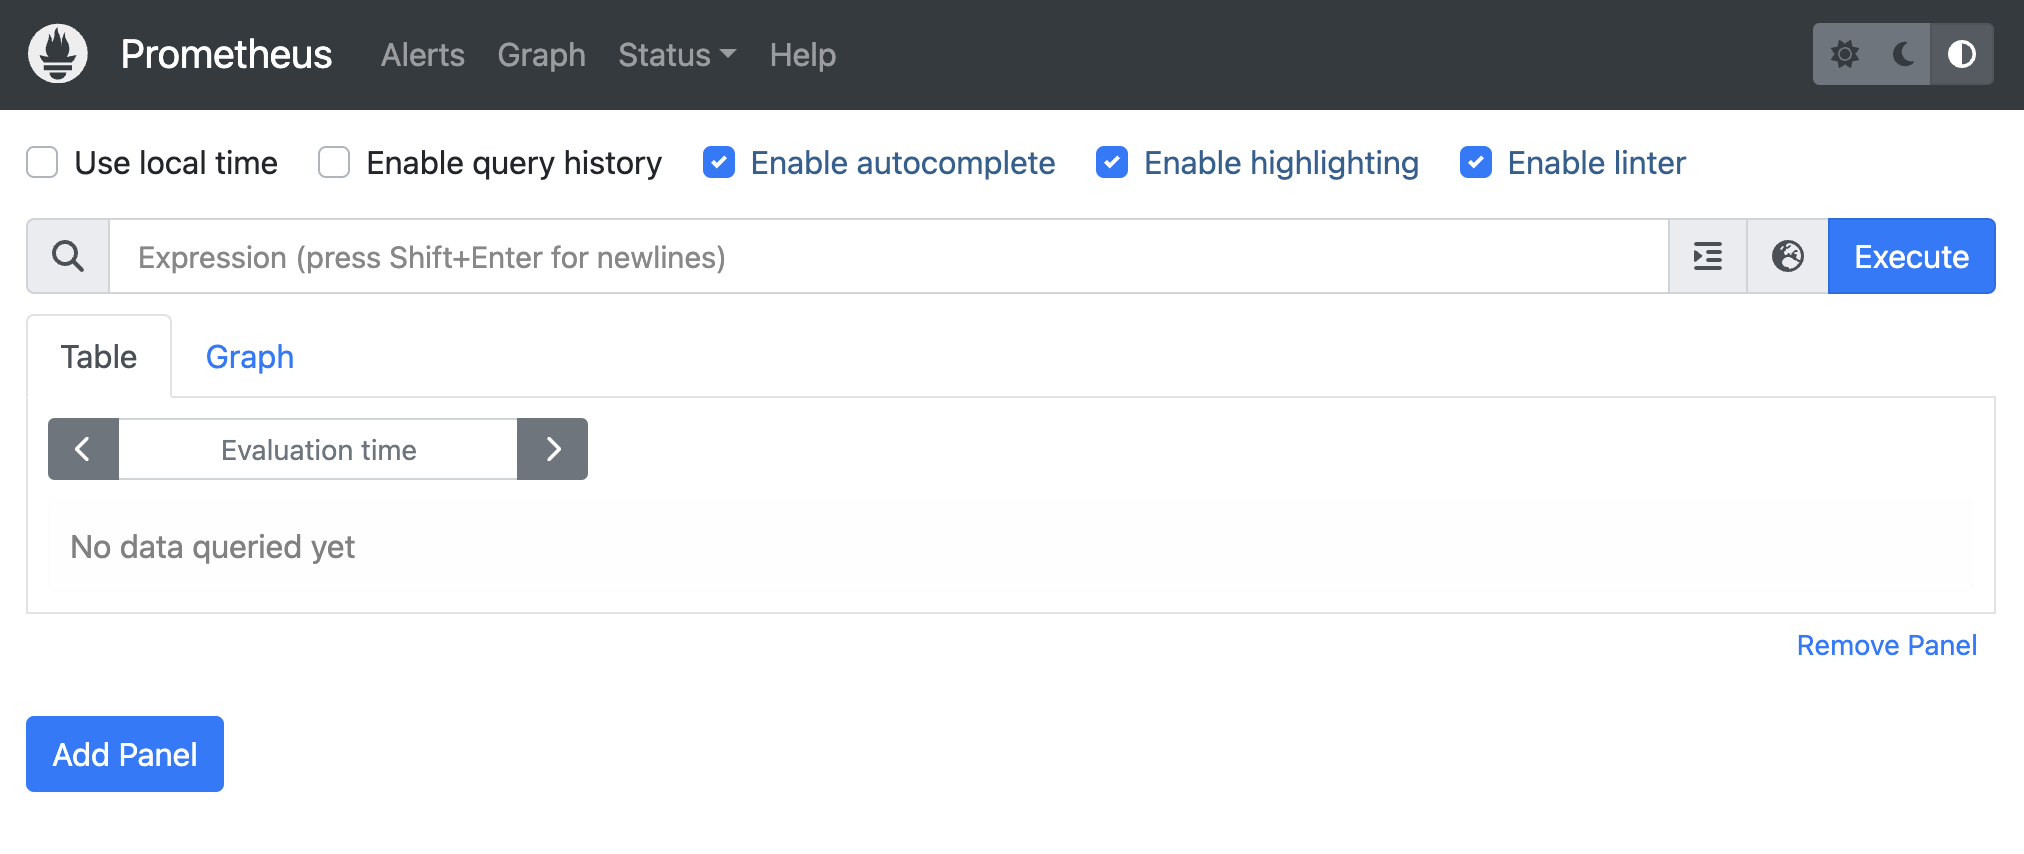
Prometheus Start Screen
There isn’t much displayed right when you start. To get a list of all the metrics that are currently available, click on the little icon called the metrics explorer:
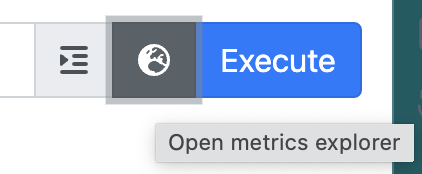
Prometheus Metrics Explorer
This will open a pop-up window with a list of all metrics. You can scroll and select the one you like, or narrow down the search by typing a certain selection string. The prefix of all the various metrics indicate the groups of collected information.
E.g. you can see that there is a range of metrics coming from the OpenTelemetry collector itself, if you type in “otel”.
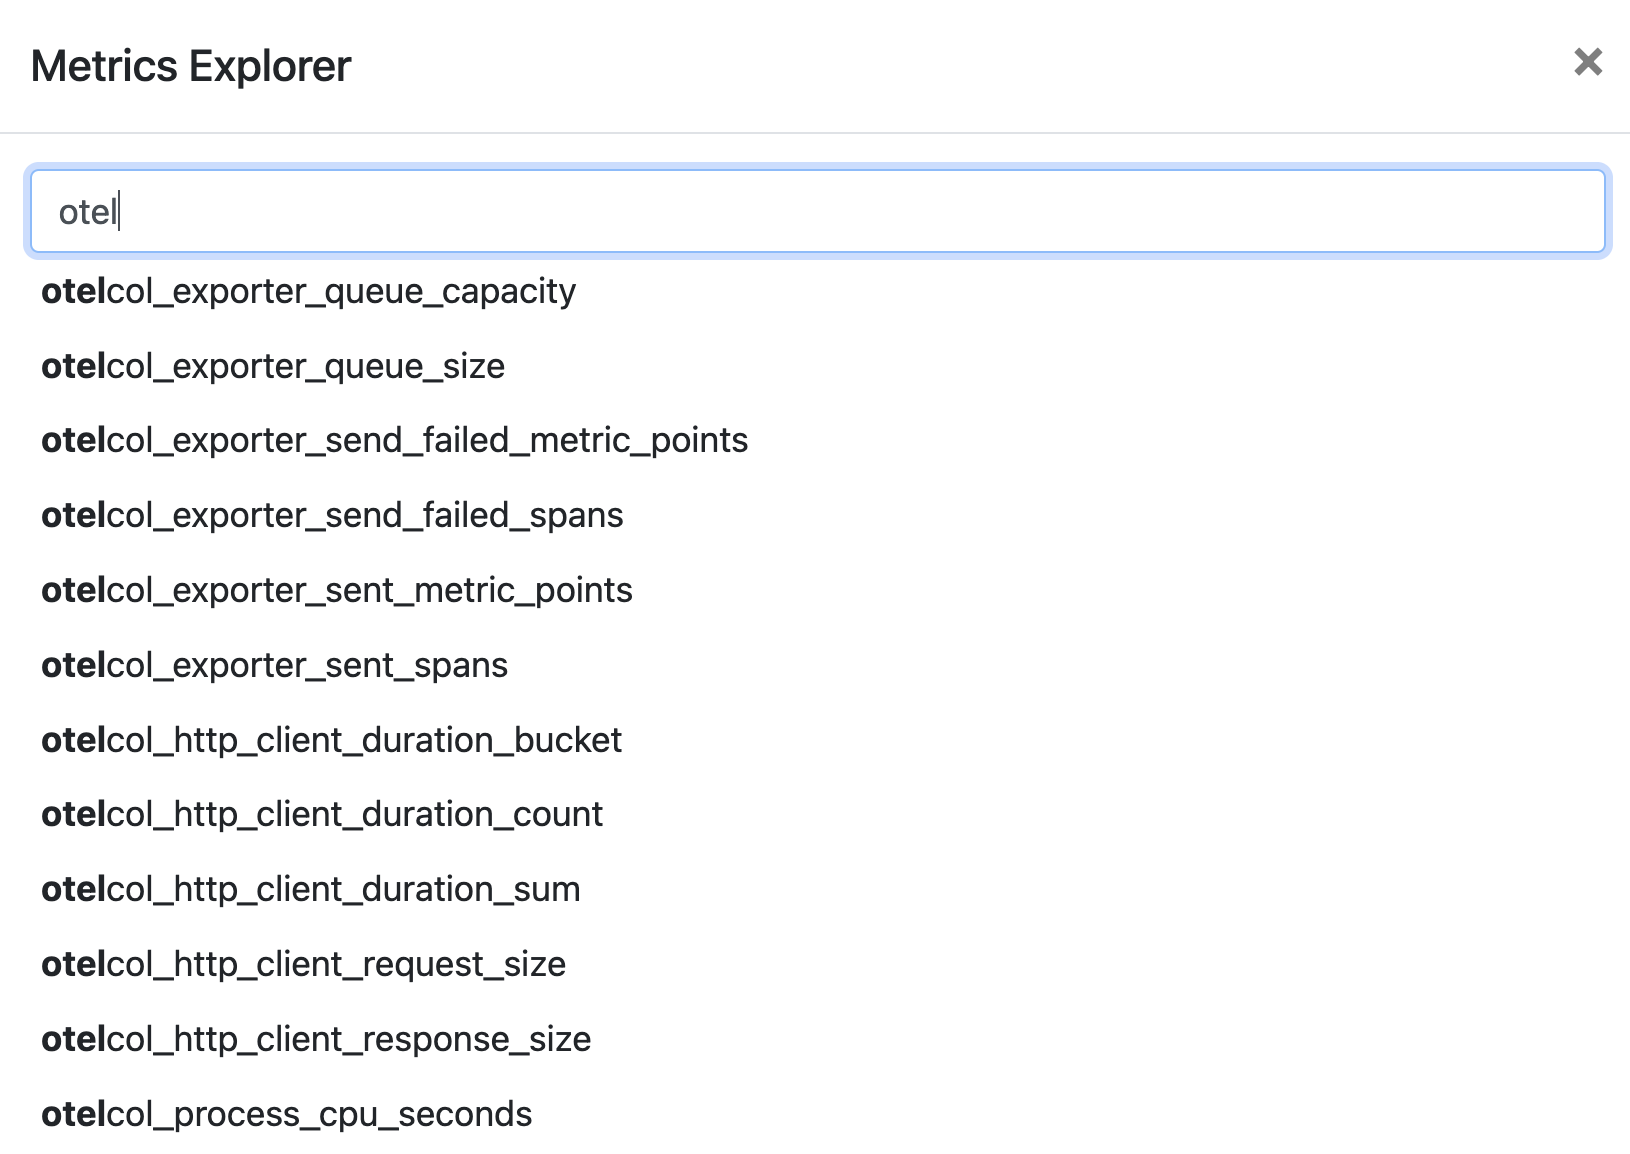
Prometheus OpenTelemetry Metrics
If you want to find out about the metrics that Java agents collect, start typing in “jvm”. You will also get a list of JVM specific metrics here.
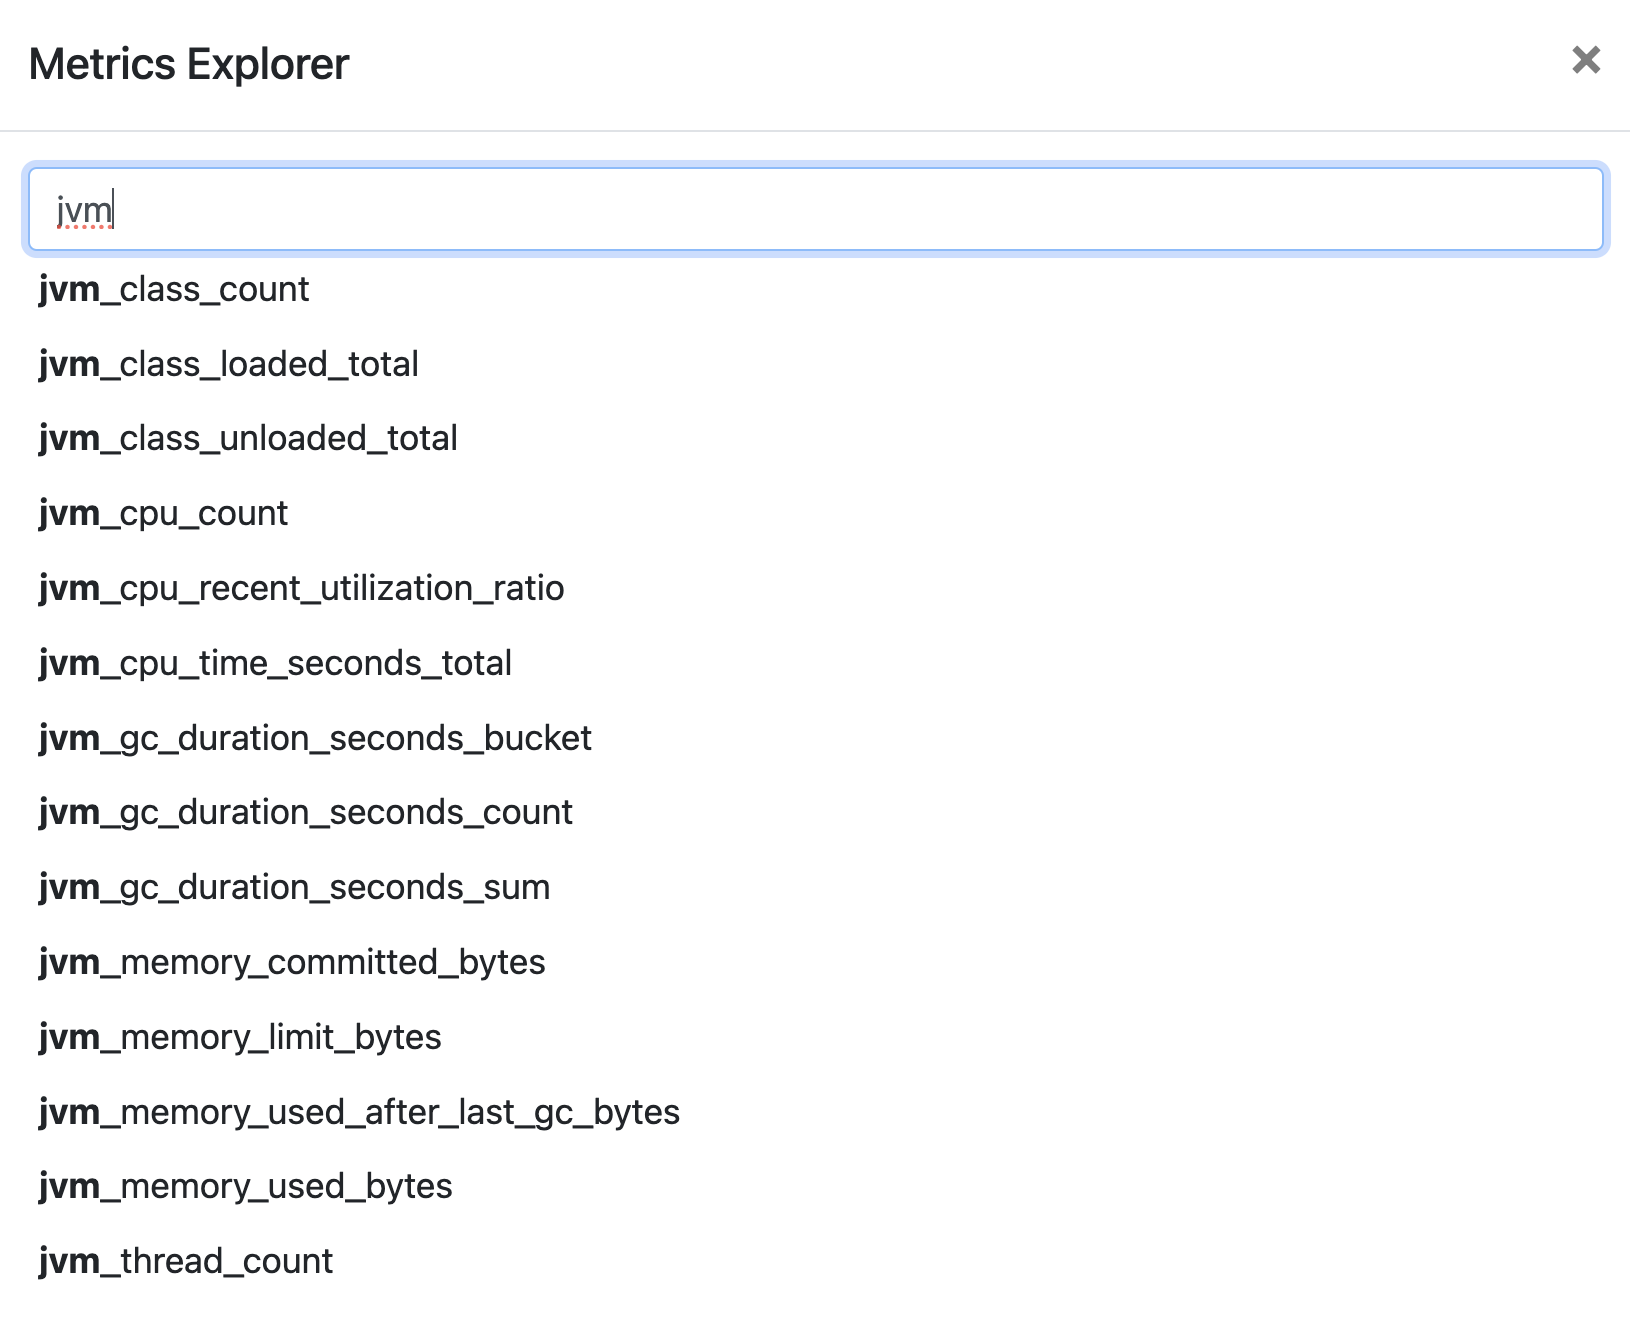
Prometheus JVM Metrics
Select “JVM Thread Count”. It will take you to a tabular output of the information collected so far. It may look different on your screen depending on the time you spent collecting.
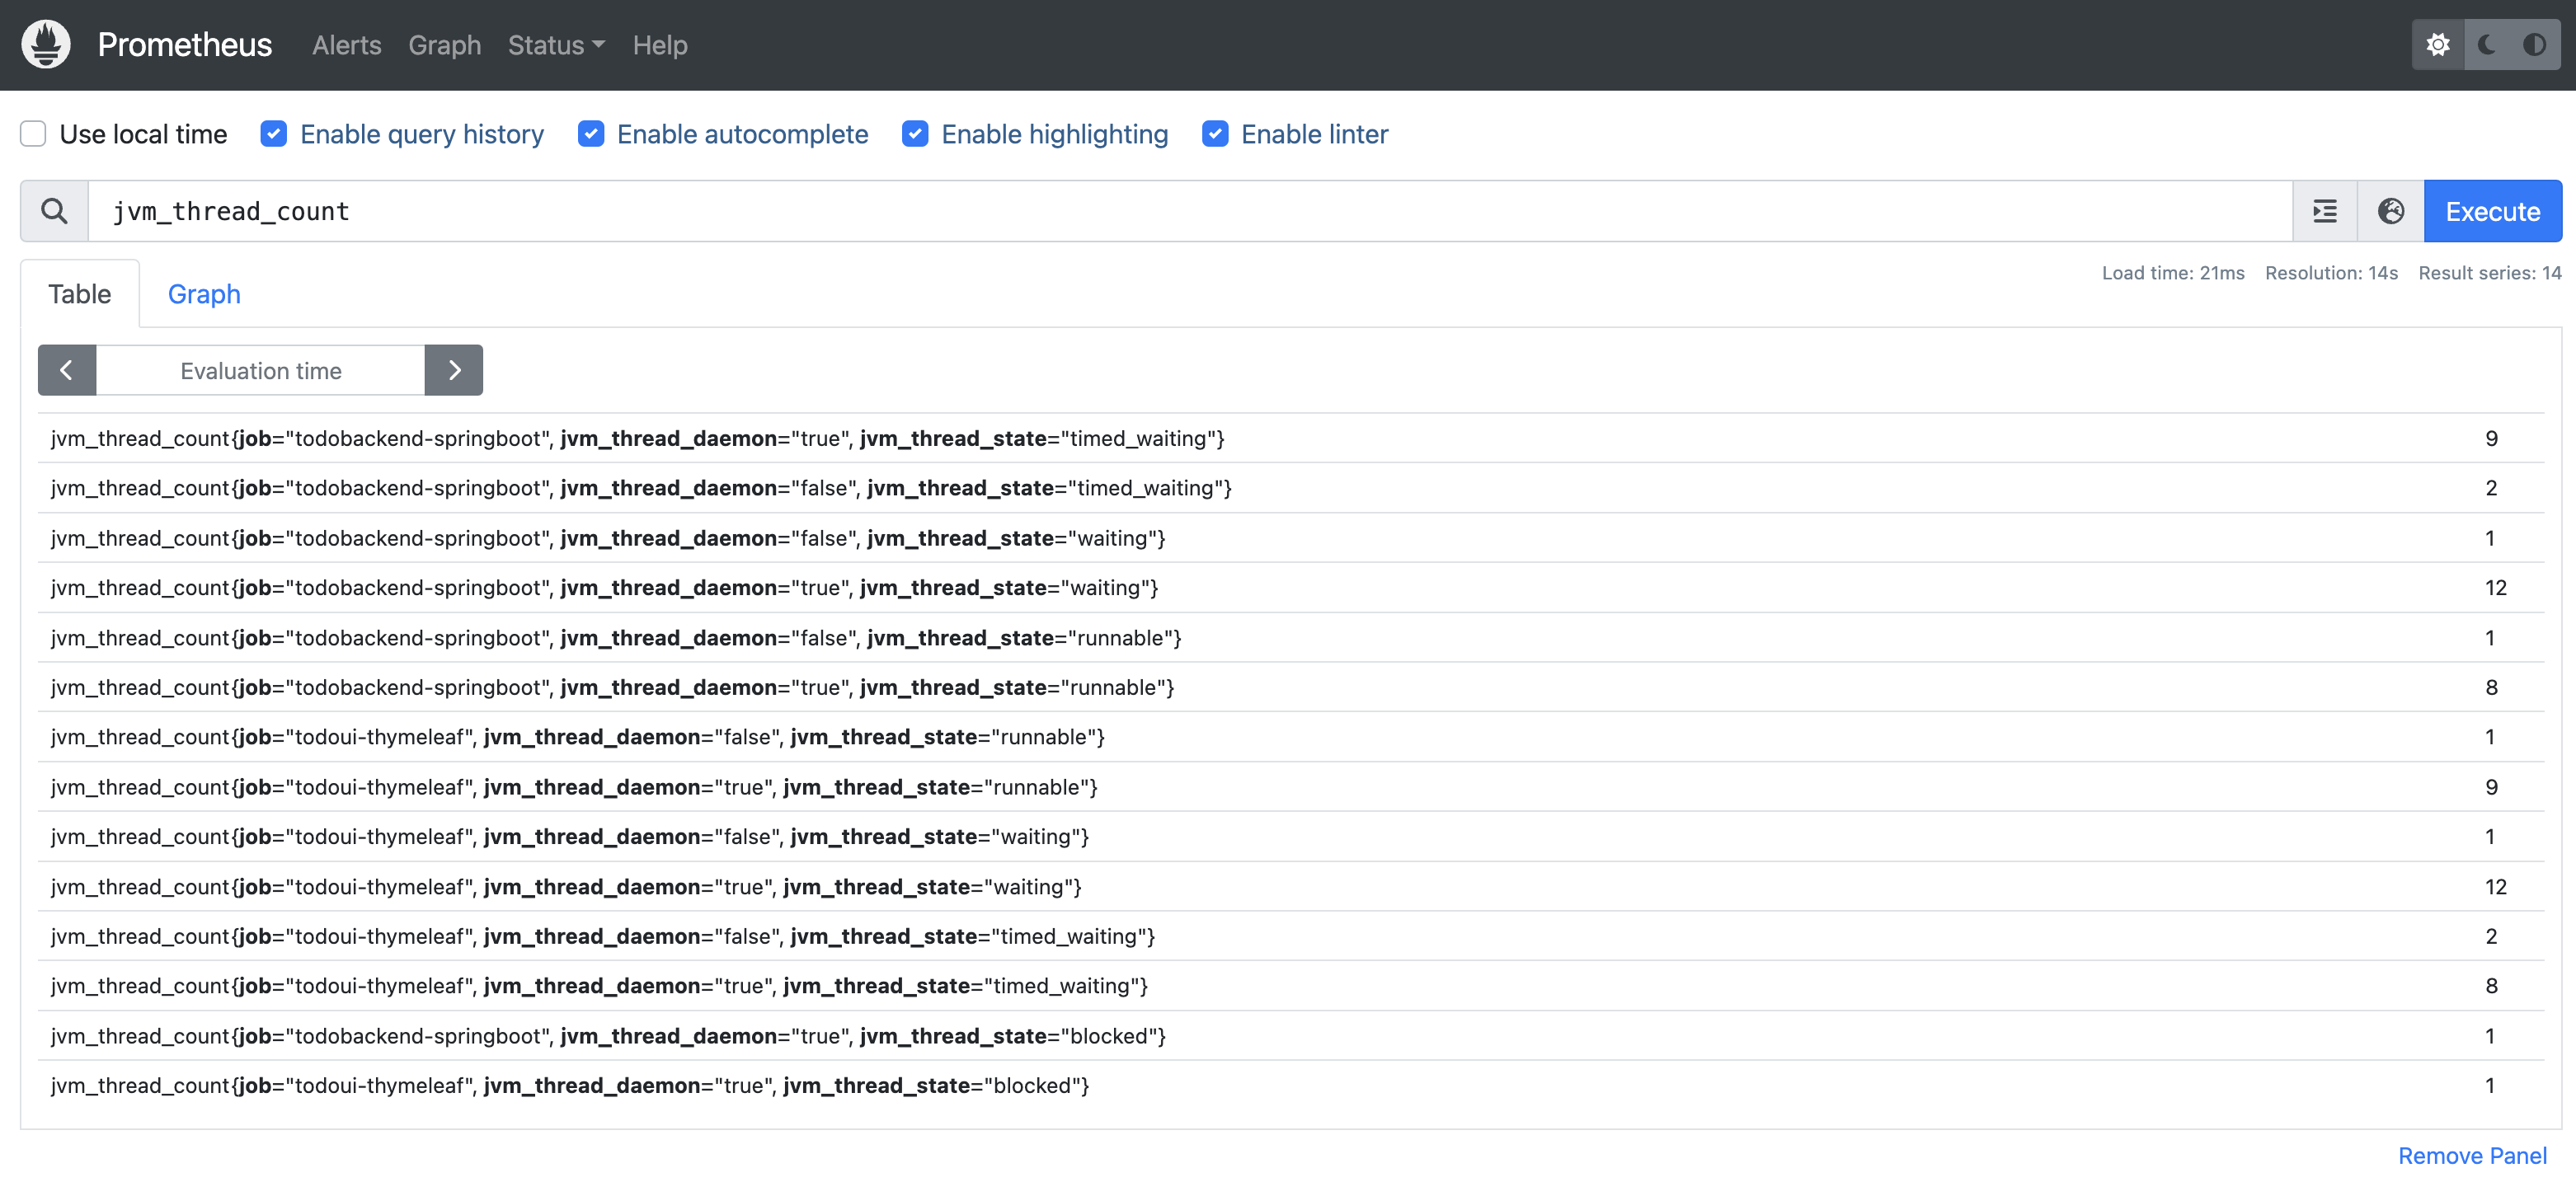
Prometheus Table JVM Thread Count
By selecting the tab “Graph” instead of “Table”, the data is visualized in a graphical form. You can adjust the time range as well.
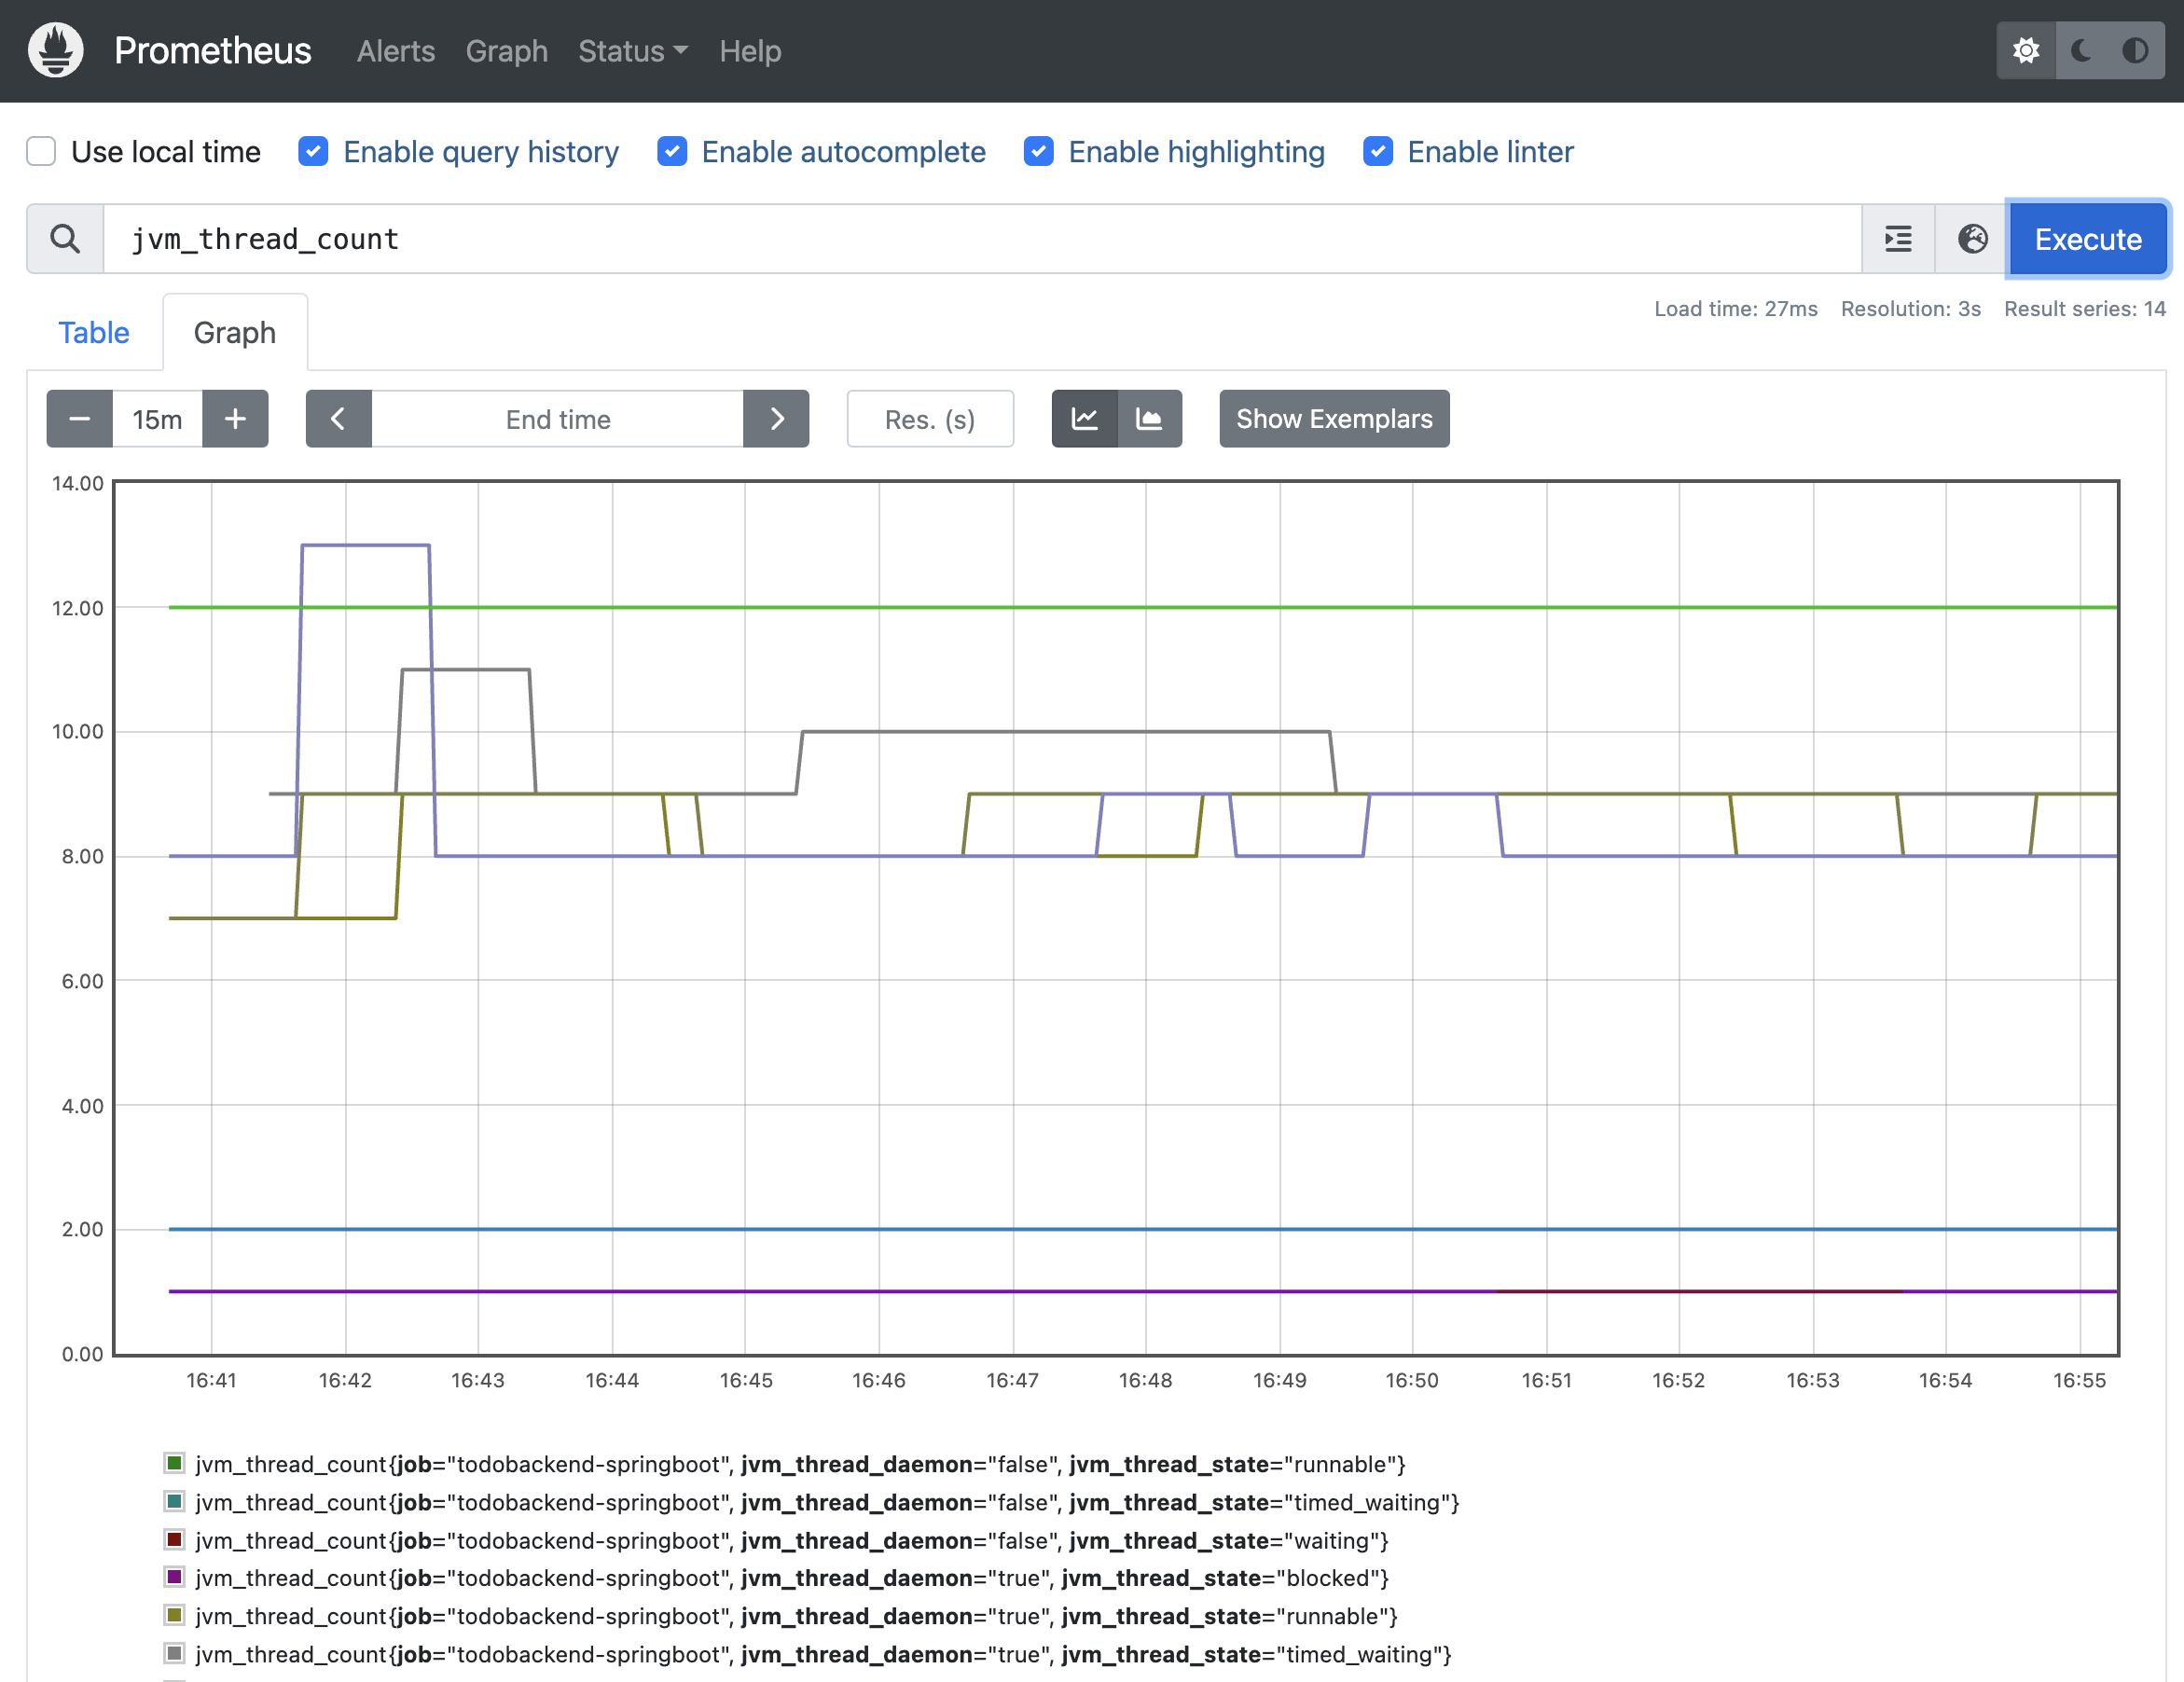
Prometheus Graph JVM Thread Count
Further meaningful visualization could be JVM memory usage:
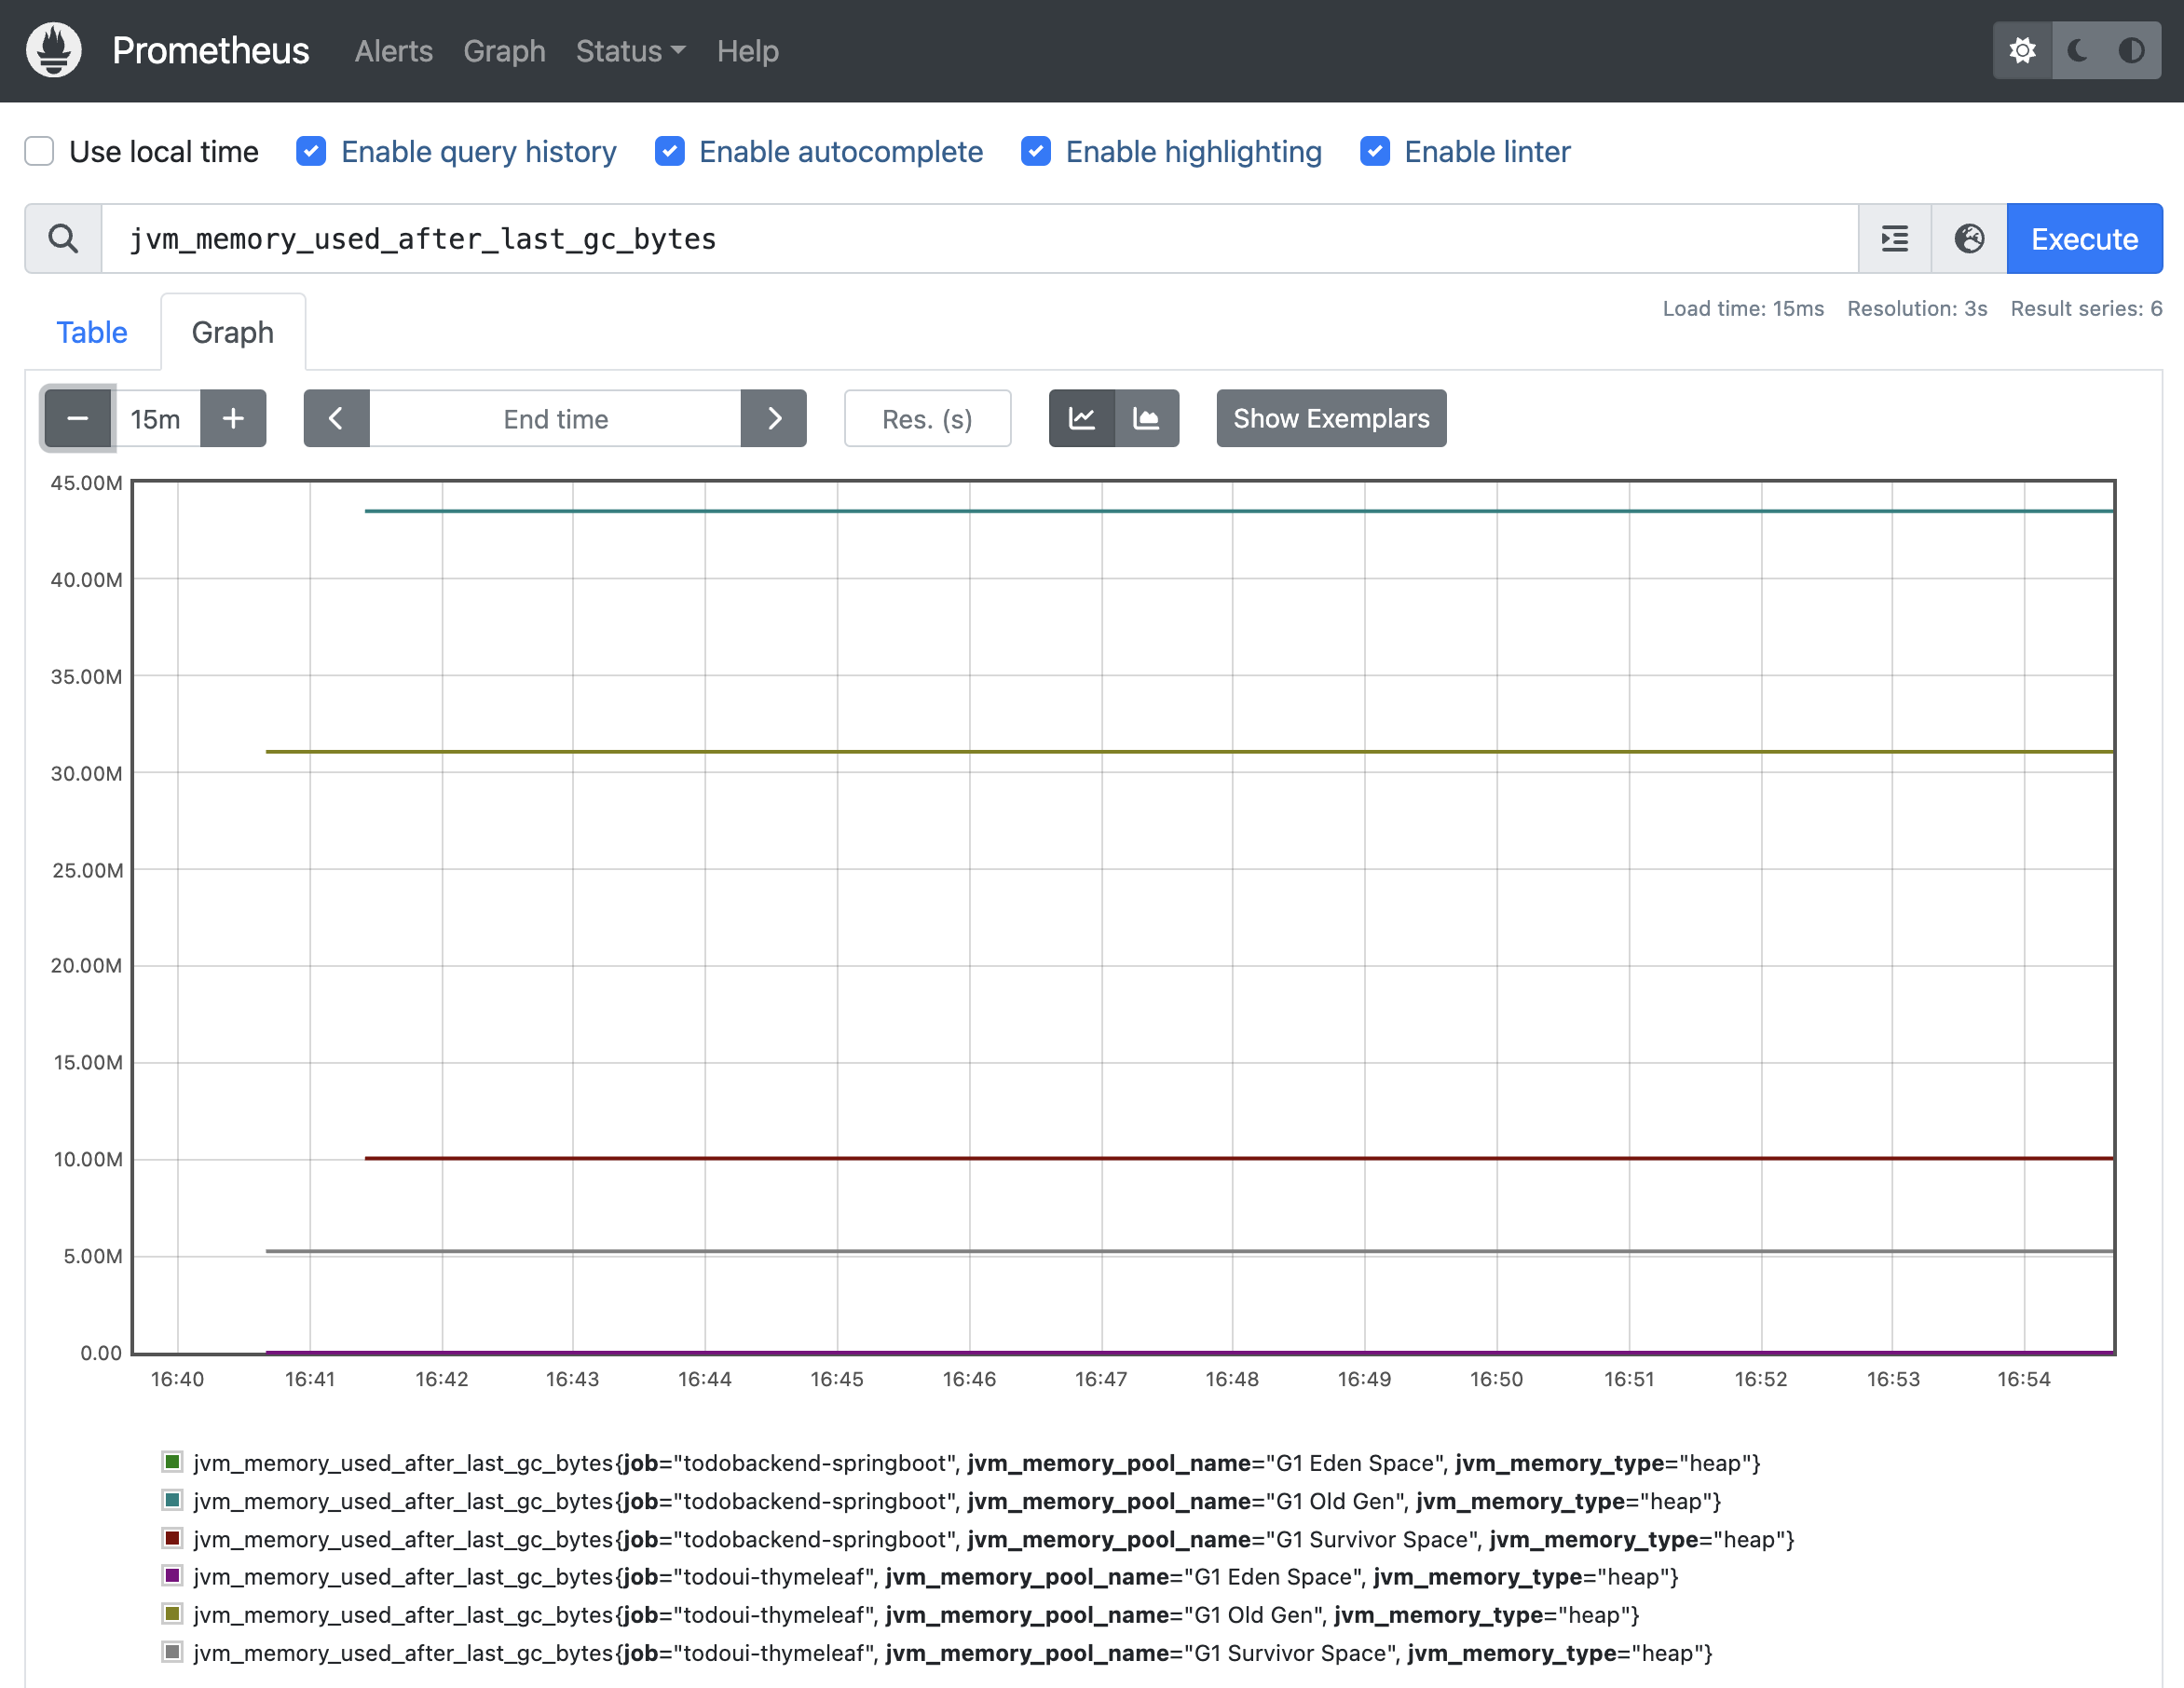
Prometheus Graph JVM Memory Usage
And garbage collection duration:
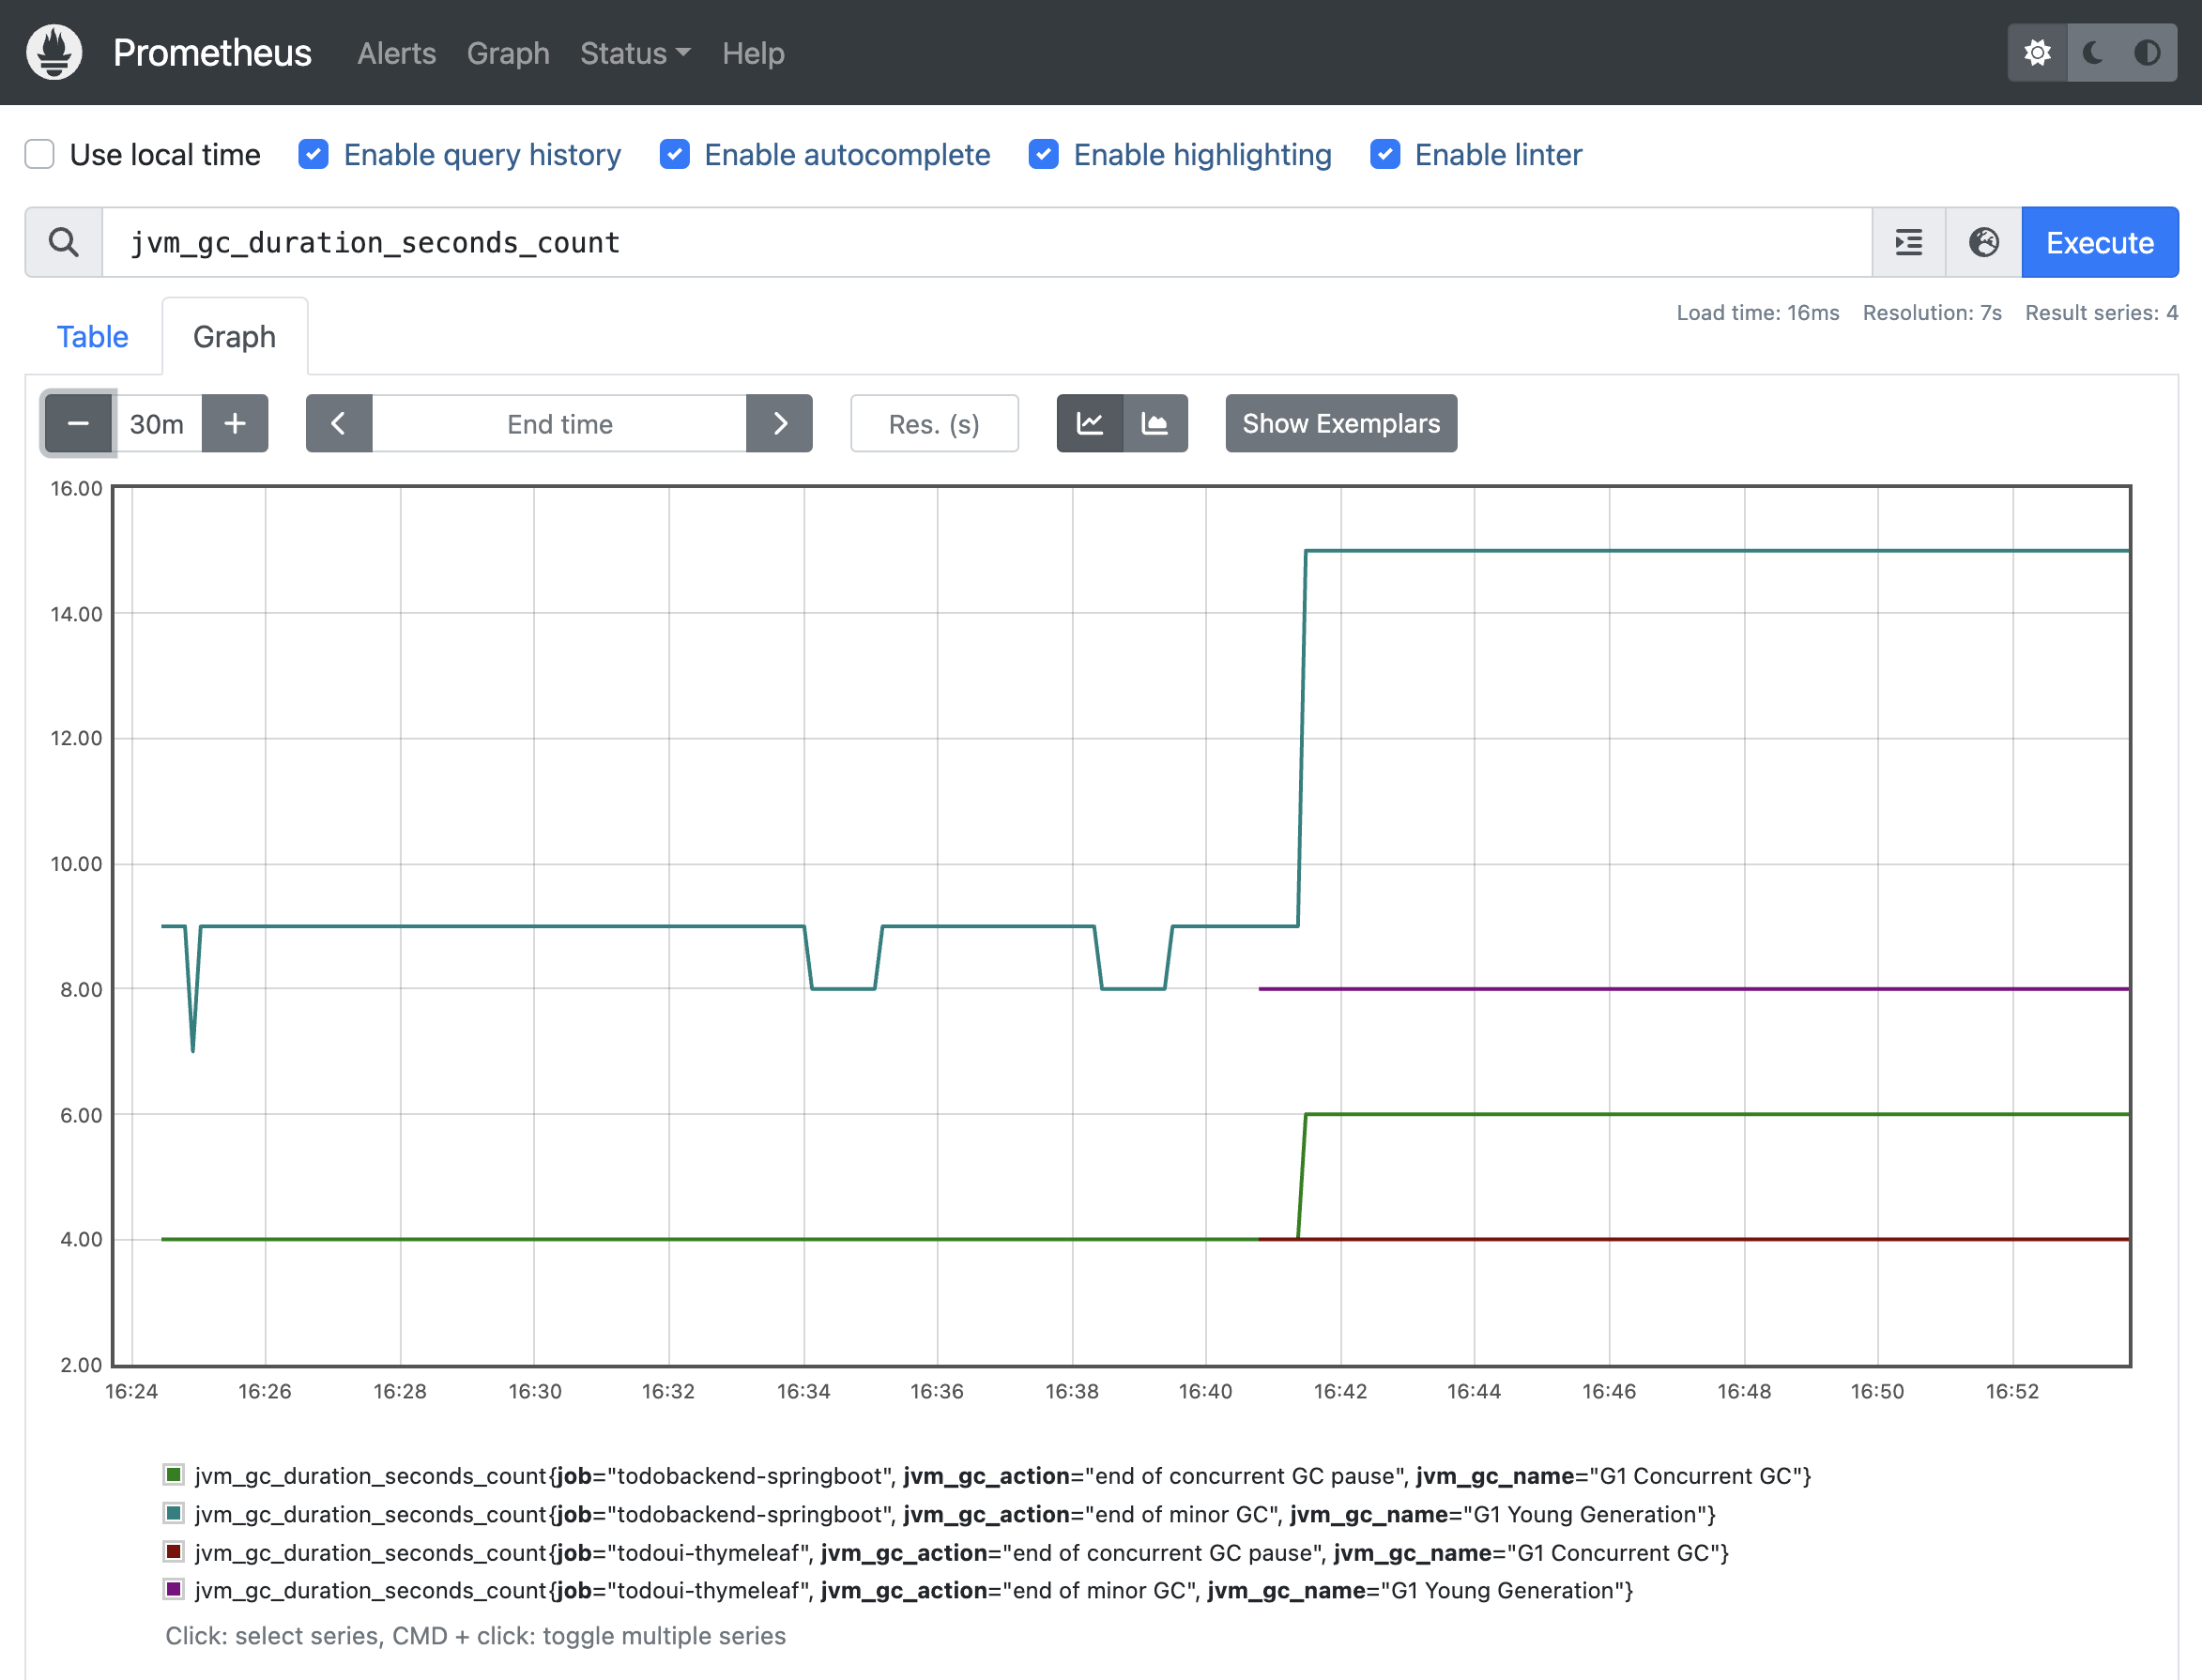
Prometheus Graph JVM Gargabe Collection Duration
We are not going to analyze individual metrics in this chapter. This is more meant to demonstrate the breadth of information, which the standard OpenTelemetry agent for Java provides. This is similar to the analysis in the traces section.
If the collected metrics of the auto-configured agents are not enough, manual instrumentation can be used. It also becomes obvious that there are no Python or Flask metrics being collected. This is how the configuration is set up in this case.